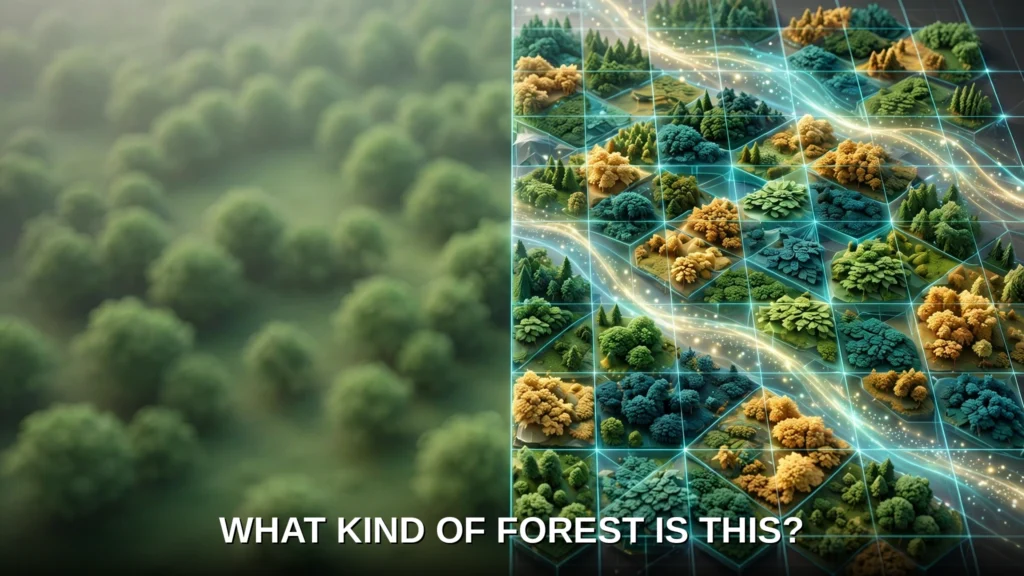



Google DeepMind has released a map that changes how the world sees its forests. The new map is a milestone for ai forest type mapping: instead of showing only where trees stand, it shows what kind of forest each patch of land holds, at a resolution of 10 metres, across land between 65°S and 84°N. The project is called Forest Typology, or ForTy, and it arrives with a year-by-year record of change from 2017 to 2025. For governments, companies and conservation groups, the difference matters. A patch of green on a satellite image can be an untouched rainforest, a timber plantation or an oil palm farm, and those three things store very different amounts of carbon and shelter very different wildlife.
ForTy 2020 was released on 22 October 2026 by Google DeepMind and Google Research, with the World Resources Institute (WRI) and the International Institute for Applied Systems Analysis (IIASA). It is described in Scientific Data, and both the map and the time series are freely available on Google Earth Engine under an open licence. The map is a baseline for the EU’s deforestation regulation, which uses 31 December 2020 as its reference date — a tool companies and regulators may soon rely on to judge whether a product is genuinely deforestation-free.
What ForTy is and why tree cover alone is not enough
A map that only records tree presence hides exactly the distinctions that matter most. Forests cover approximately 31% of the world’s land area and store roughly 662 gigatonnes of carbon, according to the background to the Scientific Data paper, yet a forest’s ecological value depends on its type and management history. A primary forest holds far more carbon and biodiversity than a single-species timber plantation. Tree cover alone cannot tell them apart.
The distinction is also a legal one. Under the European Union’s Regulation on Deforestation-free Products (EUDR), products sold in or exported to the EU must not come from land that was deforested or degraded after 31 December 2020. For wood products, that includes primary forest converted into plantation or planted forest, and naturally regenerating forest converted into plantation. A company trying to prove compliance therefore needs to know not just where trees are, but what kind of forest they form, and what replaced that forest after a harvest. ForTy is designed to answer those questions at 10-metre resolution.
The project builds on Natural Forests of the World 2020, a 10-metre map that answered only whether a patch was natural forest in 2020. ForTy goes further, showing which kind of forest is there, and how that changes each year.
The six forest and land-use types
ForTy sorts land into six categories: primary forest, naturally regenerating forest, planted forest, plantation forest, tree crops and agroforestry, and other land.
The catalogue distinguishes planted forest from plantation forest by rotation period: planted forest carries a rotation period exceeding 40 years, while plantation forest carries a rotation period of 40 years or less.
Two distinctions in that list do most of the work. The first is between natural and planted origins, and the second is between timber production and tree crops. A map that confuses an oil palm estate with a timber plantation would mislead both conservation accounting and compliance checks. ForTy’s contribution is to make those distinctions consistently and at 10-metre detail across the mapped latitude range.
How AI forest type mapping tells forest types apart

Telling forest types apart from space is hard because forest typology is, at heart, a land-use classification, while satellites observe land cover. The categories depend in part on how land is used and managed, not just on how it looks, which is why the model must learn those distinctions from labelled examples and satellite embeddings rather than from appearance alone.
The ForTy team tackled that problem with scale. Training the model used about 1.7 million labelled locations drawn from expert surveys, national and regional datasets and targeted reviews of places where the model struggled. The Scientific Data paper describes a three-stage cascaded training pipeline for the model.
A key input to the model is AlphaEarth Foundations embeddings: compact, data-rich summaries of years of satellite observations for each 10-metre pixel. AlphaEarth Foundations is a geospatial foundation model from Google DeepMind, released in 2025, whose Satellite Embeddings dataset in Google Earth Engine represents each 10-metre pixel with a 64-dimensional vector, summarised annually. Those embeddings encode spectral, temporal and environmental patterns, so the ForTy model can spot subtle clues such as planting patterns, growth cycles and harvest rhythms that separate a plantation from a naturally regenerating forest even when both look green from above.
Rather than forcing a single hard label on each pixel, ForTy distributes per-class probability scores. A company assessing EUDR risk might accept only pixels the model is highly certain about, while a researcher estimating total forest extent might use the full spectrum of probabilities. The map adapts to the question being asked, instead of pretending to a certainty it does not have.
How accurate is it, and how was it tested?
A map is only useful if people can trust it, and the ForTy team tested it unusually thoroughly. With IIASA and WRI, they validated the map against an independent, globally stratified random sample of 9,100 sites around the world. At each site, two trained experts studied high-resolution imagery and years of satellite records to determine which type of land was really there. Of those sites, 8,190 were fully resolved through expert consensus and used for accuracy estimation.
The results, as reported in the Scientific Data paper, are a stratified overall accuracy of 90.2% across all six classes, and 94.8% for the simpler binary distinction between natural forest and non-natural land. The DeepMind announcement rounds those figures to 90% for forest type and 95% for forest versus non-forest. The paper’s figures are the ones to quote, since they describe the sample and the method behind them.
That global average does not establish accuracy for an individual pixel or class: 90.2% is an aggregate over a six-way task, and per-class and regional validation remain questions requiring further evidence. That is why the per-class probability scores matter: they let a careful user see where the model is confident and where it is not, rather than hiding uncertainty behind a single colour on a map.
From one snapshot to a story of change, 2017 to 2025
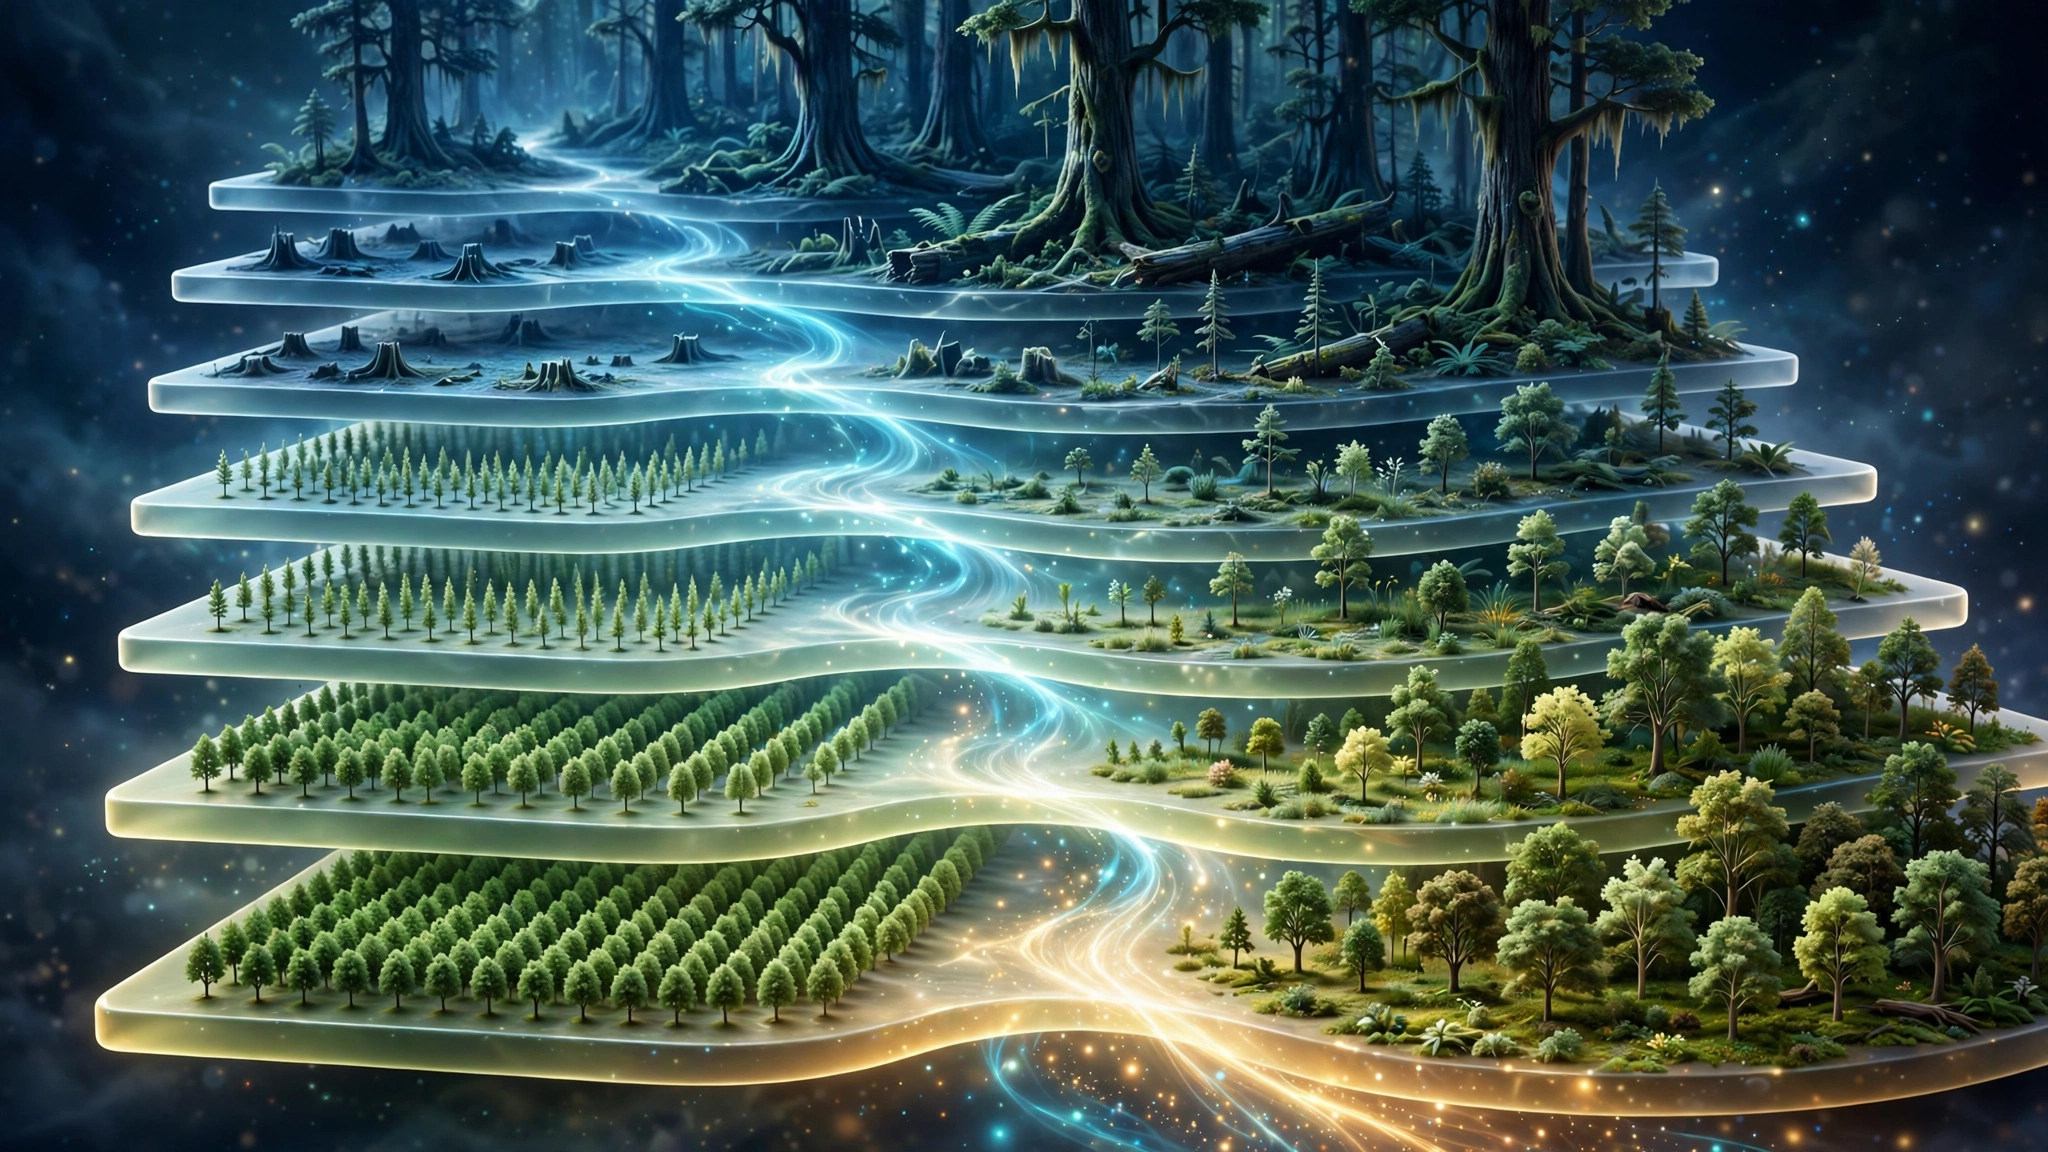
A map of a single year is a useful baseline, but forests change, and the most important changes are often the hardest to see. The ForTy 2020 map is accompanied by an early-release time series that applies a similar approach to every year from 2017 to 2025. It shows not only where forests disappear and where they grow back, but what kind of change happened: a natural forest turned into a timber plantation, for example, or abandoned land slowly regenerating into forest.
That distinction exposes changes that standard tree-cover maps miss. When a natural forest is logged and replanted as a plantation, the land soon looks green again, so a map that only tracks tree presence might record no loss at all. Under the EUDR, however, that conversion counts as forest degradation, and it matters for carbon and biodiversity even though the canopy has returned. ForTy’s time series makes these hidden changes visible, both losses and gains, year by year and at 10-metre detail.
The time series is explicitly an early release, and the team says it will keep improving it with partners and users. That honesty is important. An early-release product should inform monitoring and risk assessment, but enforcement decisions that turn on a single pixel or a single year should be checked against the underlying probabilities and, where the stakes are high, against independent evidence on the ground.
Who uses a forest-type map, and for what?
The first users are the ones the regulation creates. Under the EUDR, companies placing cattle, cocoa, coffee, oil palm, rubber, soy or timber, and products made from them, on the EU market must show their products are deforestation-free. Compliance is required from 30 December 2026 for large companies and from 30 June 2027 for small enterprises. A shared 2020 baseline at 10-metre resolution, with a change record to 2025, gives those companies and regulators a common starting point for checking origin claims.
Governments and conservation groups are the second audience. The same map can direct forest finance to where it is needed, show where conservation is working and where natural forests are being converted into plantations and farms, and support protection of the natural forests that matter most. Because the data are open on Google Earth Engine, smaller organisations and researchers in producer countries can use the same evidence base as large companies and regulators, rather than relying on proprietary datasets they cannot inspect.
ForTy also sits within Google’s wider AI for Nature work and Google Earth AI, its collection of geospatial models for environmental challenges. Its value will grow if it becomes one layer among many, combined with local knowledge and ground surveys, rather than treated as a single oracle.
Limits and open questions
ForTy is a strong baseline, not a finished answer. Its time series is an early release, and its aggregate accuracy does not establish accuracy for any individual pixel or class. The per-class probabilities guard against overconfidence, but only if users consult them instead of reading the majority class as fact.
Three questions remain open. First, independent assessment: the validation described here was carried out by the developers and their partners, and whether independent external assessments confirm it remains an open question for how the map performs in specific regions and for specific decisions. Second, per-class performance: the paper’s headline accuracy is an average, and users concerned with a particular class, such as planted forest, should look for the detailed scores before relying on the map for that class. Third, the limits of remote sensing itself: how far can distinctions that rest on management history and intent be established from satellite evidence alone? The supplied research leaves that as an open question.
None of that diminishes what has been achieved. For the first time, anyone can open a free map, covering land between 65°S and 84°N, and see, at 10-metre detail and year by year, not just where forest was lost, but what replaced it. Protecting the planet’s forests starts with a simple question, as the DeepMind team puts it: what type of forest are we looking at? ForTy does not answer that question perfectly, but it answers it across that mapped range, in the open, and that is a genuine step forward for ai forest type mapping.