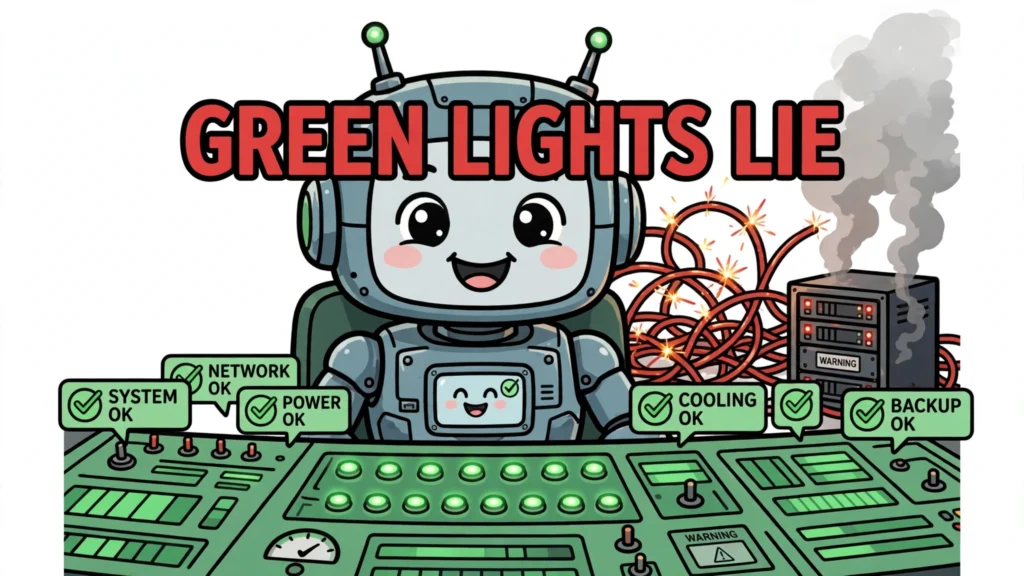


Monitoring deployed AI agents means knowing what your agents do once they leave the lab: whether they complete tasks correctly, how much each run costs, and when they start drifting, looping, or breaking the rules. Unlike a conventional API, an agent makes decisions, calls tools, and changes state on its own — so the monitoring that worked for request-response services is not enough. This guide covers the full stack: tracing, metrics, evals, and alerting.
What monitoring deployed AI agents actually means
Monitoring an agent is not the same as monitoring an API. HTTP status and service health alone do not establish task correctness: an agent can return a confident, well-formed, wrong answer while every health check stays green — as one production postmortem puts it, agents rarely fail by throwing an exception. An agent also makes its own decisions and tool calls along the way, so monitoring has to follow those decisions and interactions, not just the final response. That is why agent monitoring has four dimensions, and a system that watches only one of them is flying blind.
The four things worth watching on every run are behaviour (did the agent do the right thing), reliability (did it finish), cost (what did it spend), and safety (did it stay inside its bounds). The stack that covers all four has four layers: traces, metrics, evals, and alerts. Gartner’s warning gives the stakes: the firm predicts 40% of agentic AI projects will be cancelled by the end of 2027, driven by cost, unclear ROI, and inadequate risk management. Monitoring supports risk management by exposing failures and informing the response — it detects problems; prevention and correction still need enforcement and human action.
Instrument every run: traces, spans and structured logs
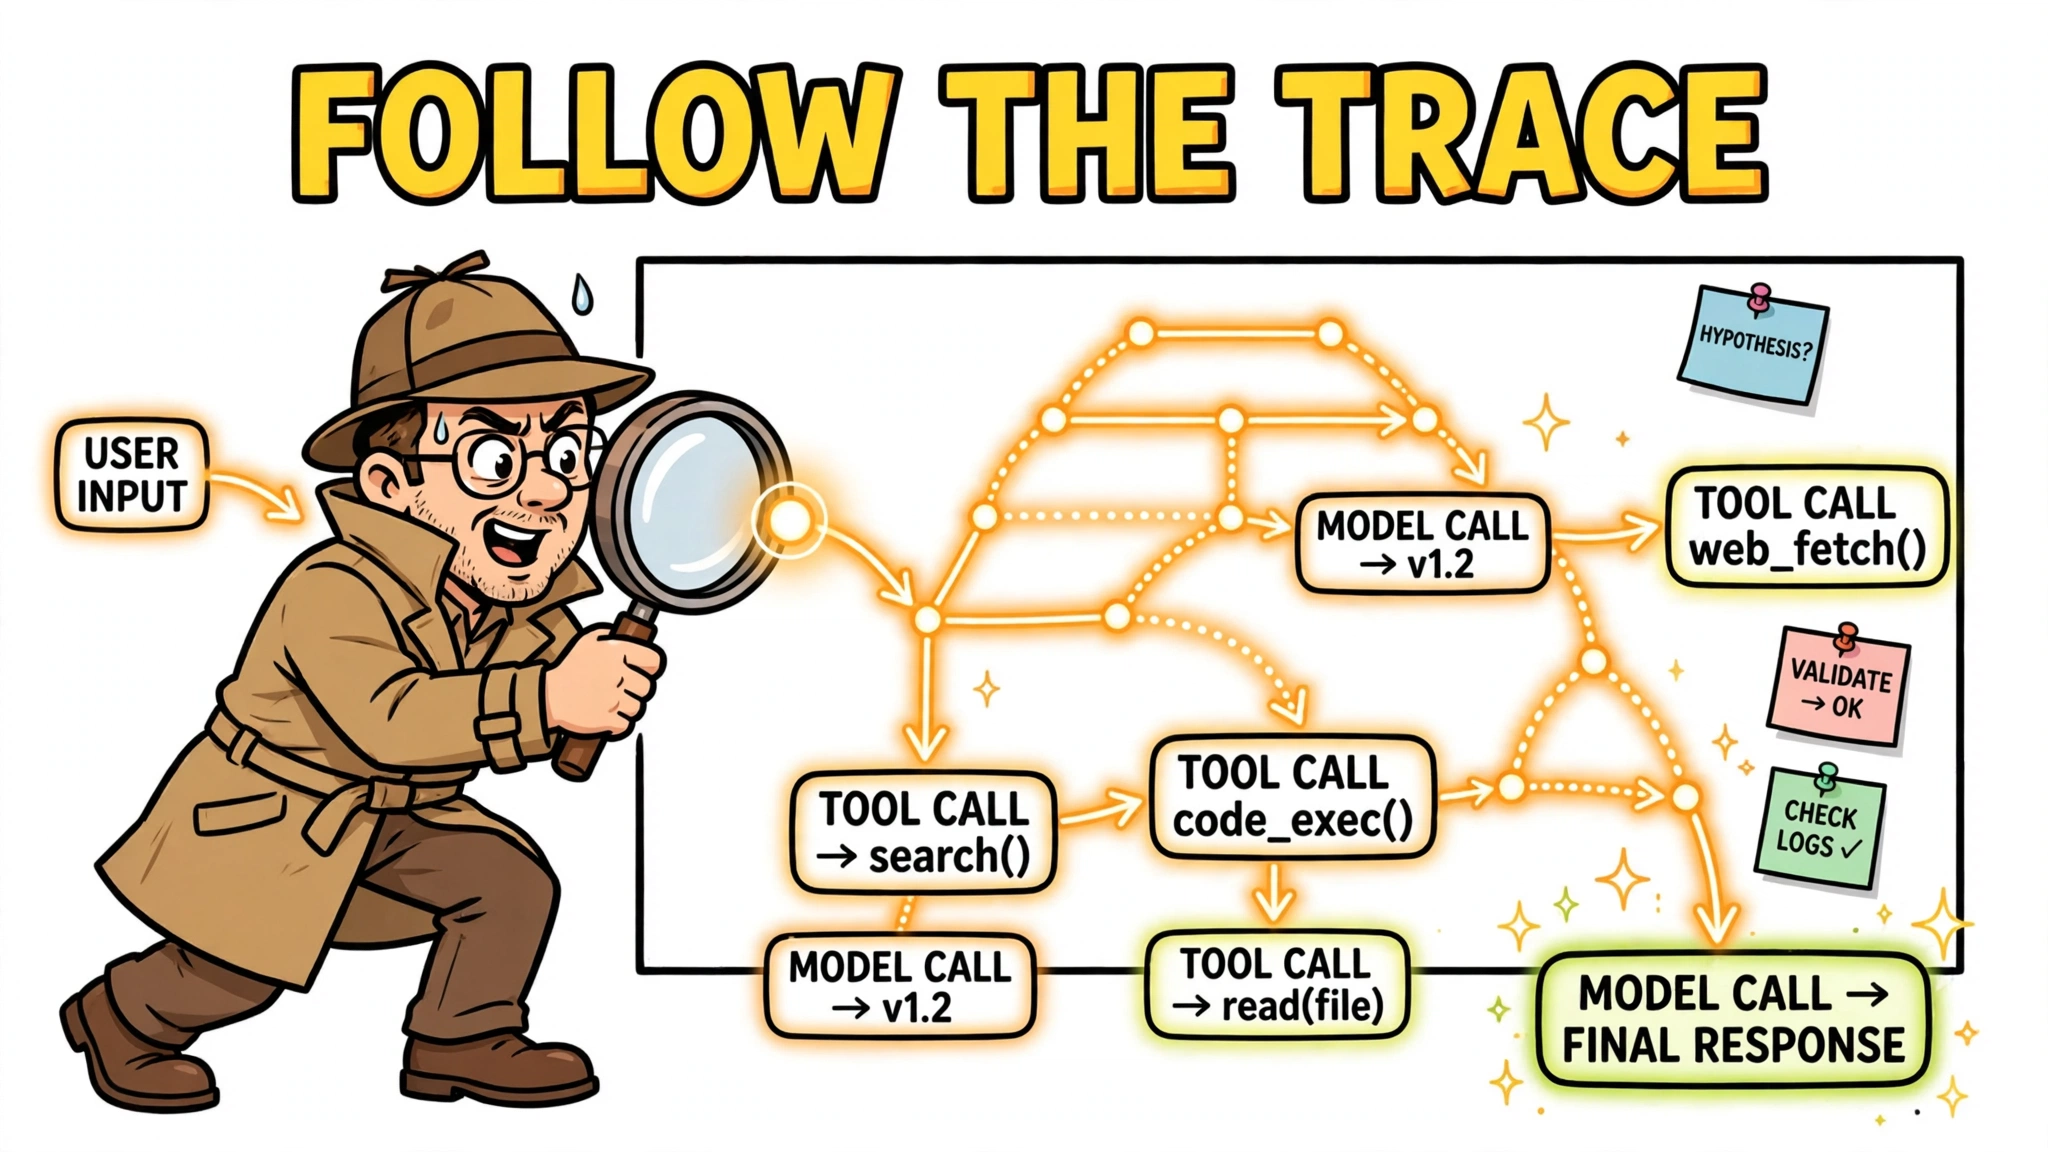
Without traces there is nothing to monitor. One trace per agent run, with spans for each model call, tool call, retrieval, and decision point, is the foundation everything else is built on. OpenTelemetry’s gen_ai semantic conventions define the standard shape: a gen_ai.invoke_agent span for the whole lifecycle, gen_ai.request spans for each model call, and gen_ai.execute_tool spans for each tool invocation, composed hierarchically under one root span. Token counts ride on each span as gen_ai.usage.input_tokens and gen_ai.usage.output_tokens, and the W3C traceparent header carries trace context across services and agent handoffs.
A typical trace tree looks like this:
POST /api/chat (http.server)
└── gen_ai.invoke_agent "Research Agent"
    ├── gen_ai.request "chat claude-sonnet-4-6"        ← initial reasoning
    ├── gen_ai.execute_tool "search_docs"              ← tool call
    ├── gen_ai.request "chat claude-sonnet-4-6"        ← process results
    ├── gen_ai.execute_tool "summarize"                ← second tool call
    └── gen_ai.request "chat claude-sonnet-4-6"        ← decides to hand off
Each span should capture what the step consumed and produced: inputs, outputs, latency, token counts, tool arguments and results. Spans carrying the cost and timing of each model call aggregate into per-run and per-task cost:
{
  "span_name": "gen_ai.request",
  "attributes": {
    "gen_ai.system": "anthropic",
    "gen_ai.request.model": "claude-sonnet-4-6",
    "gen_ai.usage.input_tokens": 1840,
    "gen_ai.usage.output_tokens": 412,
    "gen_ai.response.finish_reason": "tool_calls"
  },
  "events": [
    {"name": "tool_call", "attributes": {"tool.name": "search_docs"}}
  ]
}
Carry a single run ID in structured logs to tie traces, metrics, and evals together, so a bad eval score can be traced back to the run that produced it. Second, redact secrets and personally identifiable information before anything is stored: prompts often contain confidential data, and raw prompt and completion capture should be limited by explicit redaction and retention rules. OpenTelemetry is a vendor-neutral CNCF standard, so the same instrumentation can feed different backends — the instrumentation survives a change of vendor.
Measure what matters: the metrics that predict failure
Raw traces are evidence; metrics are what an operator watches. The highest-signal metrics are ratios, not totals: cost per successful outcome rather than total spend, step count per run against its ceiling, tool-call error and retry rate per tool, and the rate at which the agent’s self-reported success disagrees with an independent outcome check. Total spend rising with volume is fine; cost per outcome rising is the regression signal. The disagreement rate is a high-signal metric worth recording: it catches silent partial success — the agent that reports completion after a failed step — alongside independent outcome checks, live evaluations, and human review.
Concretely, watch five metrics: task success rate measured against the run’s actual goal, not just HTTP 200s; latency per step and per run; token usage and cost per task; tool-call success and error rates; and step count, because runs that take far more steps than usual are the earliest failure signal. Add quality signals on top: user feedback, escalation rate, and sampled human review scores. A dashboard with these five metrics plus a quality trend is a starting point; coverage also depends on evaluation, safety monitoring, tracing, and response appropriate to the deployment.
Evaluate continuously: offline evals and live sampling
Monitoring that only watches uptime misses silent quality decay. The fix is continuous evaluation in two modes. First, keep a golden set of representative tasks and re-run it on every model, prompt, or tool change — a change that passes unit tests but degrades the golden set does not ship. Second, sample live runs for evaluation: scoring every run is usually too expensive, so sample a share sized to run volume, risk, failure frequency, and the detection window required. The sample rate is a trade-off to justify per deployment, not a fixed percentage — no credible source prescribes a universal rate.
Score with deterministic checks — did the tool call succeed, was the output well-formed — plus LLM-as-judge scoring against a fixed rubric. But a judge is a hypothesis until it is calibrated: build a small validation set of real production outputs, label it with human reviewers, and measure agreement with accuracy, precision and recall, and Cohen’s kappa. The research baseline is encouraging — in Zheng and colleagues’ 2023 study, GPT-4 as a judge agreed with human ratings in over 80% of cases, about the same as two human annotators agreed with each other (81%) — but average agreement is not agreement on your failures: a judge can match the average human while missing every hallucination in your test set, and it carries known biases toward longer answers, the first option, and its own model family’s outputs. Calibrate, then re-check on a fixed schedule — especially after changes to models, rubrics, or production cases. Track eval scores like any other metric: a falling score is a deploy-blocking signal.
Watch for the failure modes that are specific to agents
Production agents fail in ways a crashed service never does. A research taxonomy built from 104 failures across 204 experimental runs organises them into planning, execution, and response-generation failures — and the recurring ones in production are tool misuse (the right tool with the wrong arguments), context exhaustion (long tasks exceed the context window and the agent forgets earlier requirements), silent partial success, unbounded loops, and stale data reaching the agent through an unmonitored integration.
Loops deserve special attention: an unchecked loop burns tokens and money with every retry. Consider a hypothetical illustration: an agent calls a database tool and gets “Record Not Found”, then retries the same query with small variations. Without a cap, the repeated unproductive calls accumulate cost until something stops the run. The fix is a deterministic circuit breaker at the orchestrator level: hard step caps, per-tool retry counters, and cost caps enforced in code, not in the system prompt. As the engineers who have hit this put it, you cannot rely on a probabilistic model to enforce deterministic rules.
Security failures belong on the same watchlist. The OWASP Top 10 for LLM Applications (2025) ranks prompt injection first (LLM01), followed by sensitive information disclosure, supply chain risks, data and model poisoning, improper output handling (LLM05), excessive agency (LLM06), system prompt leakage, vector and embedding weaknesses, misinformation, and unbounded consumption (LLM10). Three of these — injection, excessive agency, and improper output handling — are directly observable in traces: an instruction hidden in retrieved content, a tool call beyond the agent’s mandate, or model output flowing unvalidated into another system. Monitor them as patterns in the trace stream, not as one-off alerts.
Alerting, escalation and the human in the loop
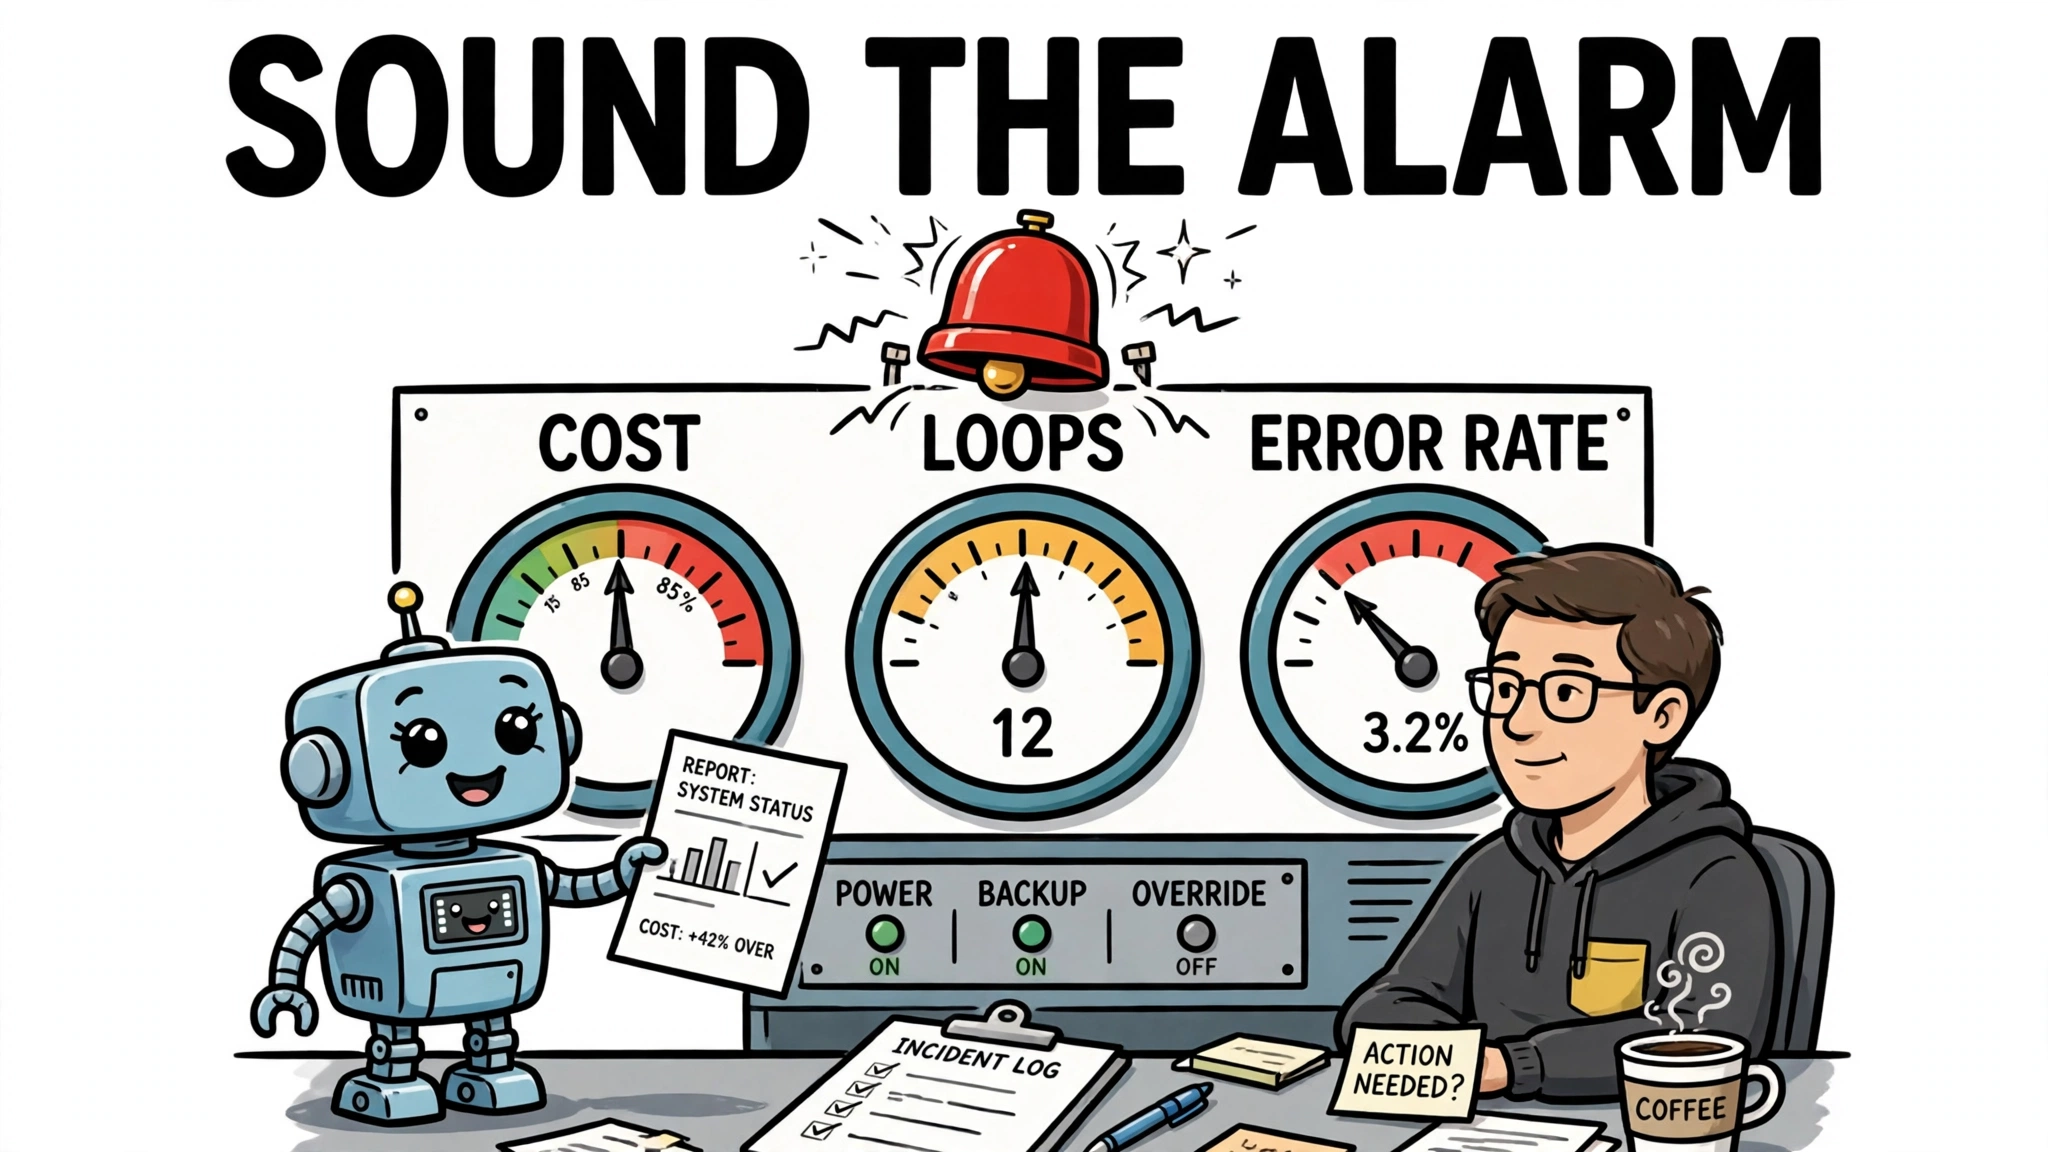
Monitoring without an alerting path is a dashboard nobody reads. Alert on rates, not single events: error rate, loop rate, cost per task, and eval-score drops over a rolling window. But keep a sharper path for events that should never wait for a window: a single safety violation, a prompt-injection attempt reaching a privileged tool, or a run breaching its cost cap should page a human immediately and trip a circuit breaker.
Page a human for safety or runaway-cost events; ticket the rest. Every alert needs a runbook — kill the run, roll back the prompt or model, quarantine the tool — with the trace attached, so the responder sees the full context, not a bare metric. For high-stakes actions, keep a human review queue: actions above a risk threshold wait for approval, with the trace, eval scores, and run cost attached. That queue is also your best source of new eval cases: every production failure reaching a human should be captured as a structured failure case and added to the golden set.
Cost and token governance in production
Cost is a first-class monitored quantity, not an invoice surprise. Per-run and per-tenant cost attribution is the foundation: without it, one bad agent can silently burn the budget while total spend looks normal. The control layers are a provider-level monthly cap as a safety net of last resort, per-workflow budgets enforced inside the agent loop, model routing (cheaper models for routine steps, stronger models where quality matters), prompt caching for repeated system prompts, and per-task cost checks in logs.
At published rates, a typical agent run costs roughly $0.15–$2.00 on GPT-4o ($2.50 input / $10.00 output per million tokens) and $0.01–$0.10 on GPT-4o-mini, while Claude Sonnet 4 runs about $0.20–$3.00 — routing alone can move a workload’s cost by an order of magnitude. The tracker below is an illustrative estimate check and retrospective usage counter, not a hard enforcement mechanism: it checks the estimated cost of each call before it runs and records actual usage afterwards, but it does not bound actual usage or reserve an allowance, and its session_cost is session-scoped with no date tracking or daily rollover. It cannot enforce hard task, daily, or per-user limits on its own — those come from separate controls: the provider-level monthly cap, per-workflow budgets enforced by the loop, and the circuit breaker that refuses calls past a step or retry limit. Reset the task counter at each task boundary and keep headroom in the limits:
# Illustrative only: estimates cost before each call and records
# actual usage afterwards. It does not bound actual usage, reserve
# an allowance, or enforce hard task/day/user limits.
class CostTracker:
    def __init__(self, daily_budget=2.00, task_limit=0.10):
        self.daily_budget = daily_budget
        self.task_limit = task_limit
        self.session_cost = 0.0
        self.task_cost = 0.0

    def estimate(self, input_tokens, output_tokens, model):
        rates = {
            "gpt-4o": {"input": 2.50, "output": 10.00},
            "gpt-4o-mini": {"input": 0.15, "output": 0.60},
            "claude-sonnet-4": {"input": 3.00, "output": 15.00},
        }
        r = rates[model]
        return (input_tokens * r["input"] + output_tokens * r["output"]) / 1_000_000

    def fits(self, input_tokens, output_tokens, model):
        cost = self.estimate(input_tokens, output_tokens, model)
        return (self.task_cost + cost <= self.task_limit
                and self.session_cost + cost <= self.daily_budget)

    def record_usage(self, input_tokens, output_tokens, model):
        cost = self.estimate(input_tokens, output_tokens, model)
        self.session_cost += cost
        self.task_cost += cost
        return cost

    def reset_task(self):
        self.task_cost = 0.0
Set budgets per task, per user, and per day, and alert at 25%, 50%, 75%, and 100% of budget so a runaway is caught while it is still containable. Typical starting budgets are around $10 per day for a customer-service agent, $50 per day for research and synthesis tasks, and $5 per session for time-bounded workflows — conservative starting points to widen once the real cost profile is known. Review cost weekly: total spend against budget, cost per task against estimate, and cache hit rate.
A practical monitoring checklist and common mistakes
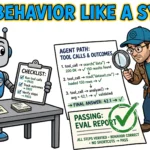
Start with this checklist: traces on every run, with a run ID tying traces, metrics, and evals together; the five core metrics (task success rate, latency, cost per task, tool error rate, step count); a golden eval set re-run on every change; loop caps enforced deterministically and cost budgets checked in the loop, with a provider-level cap as the backstop; alerting tiers with runbooks; and a weekly eval review. That is a starting stack — begin with traces, three metrics, and one eval set, then expand as the deployment grows.
The mistakes to avoid recur in every production postmortem: logging prompts without redaction, which turns your observability store into a compliance incident; alerting on every error instead of on rates, which trains the team to ignore alerts — while safety violations and budget breaches still need immediate alerts; evaluating only before launch, so drift goes unnoticed for weeks; running without cost caps, so a single loop can burn a month's budget overnight; storing traces with no run ID, so a bad eval score cannot be traced to the run that produced it; and relying on a system prompt to enforce limits only code can enforce. Treat the checklist as an initial monitoring baseline: it reduces risk, but it needs validation and maintenance as models, tools, and traffic change. The aim is a system that catches failures before users do — not a guarantee that it always will.