Implementing ai agent observability means being able to reconstruct a whole agent run after the fact: what the agent did, in what order, with what inputs and outputs, at what cost, and where it went wrong. A single prompt and a single response are not enough, because an agent run is rarely a single request. It is a chain of model calls, tool calls, retrievals and decisions, and any one of those steps can fail, loop, or quietly produce a wrong result while the final answer still looks plausible. Observability is the practice of recording that chain in a form you can inspect, query and learn from, rather than guessing from a log line that says only that something failed.
What AI agent observability means
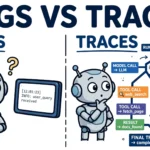
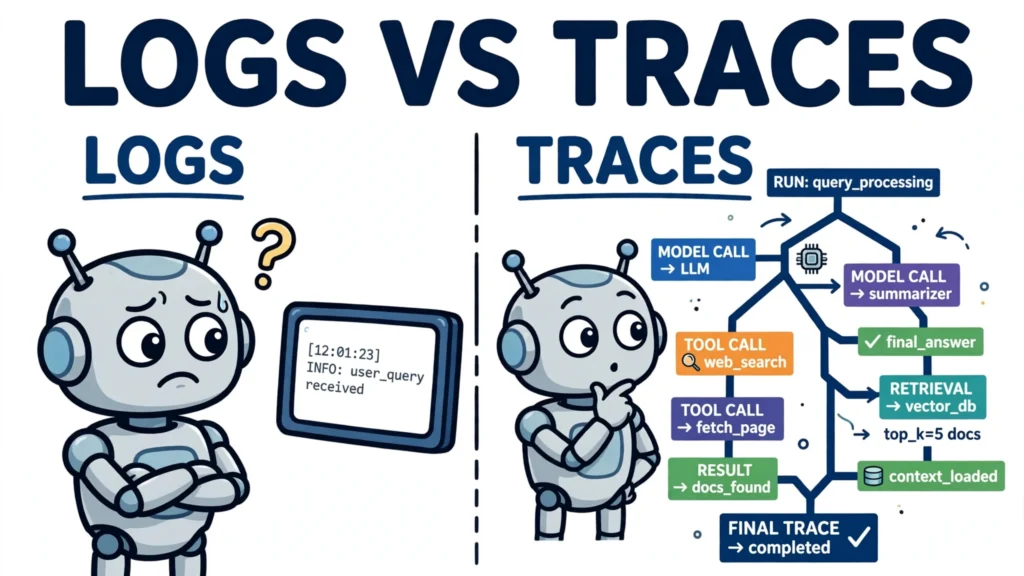
An agent run is a tree, not a line. One user request can trigger a model call, then a tool call, then another model call, then another tool call, and so on until the agent produces a final answer. In tracing terminology, the whole run is a trace, and each step inside it is a span. A span can be a model call, a tool invocation, a retrieval step, or a custom step such as a guardrail check. Spans nest: a tool span sits inside the step that called it, and all of them sit inside the trace for the run.
That structure is what distinguishes observability from ordinary logging. A log tells you that an event happened at a time. A trace tells you the shape of the run: which step ran when, how long it took, what it received, what it returned, and which step caused the next one. Without that shape, a failed agent run is a black box. With it, you can find the broken step instead of re-reading the whole conversation and hoping the problem is obvious.
It also differs from logging a prompt and a response. Prompt-plus-response logging captures the beginning and the end of a model call, but it does not capture the tool calls in between, the retries, the retrieval results, or the order in which decisions were made. Those middle steps are possible failure locations, so they are exactly the steps observability must record.
The signals to capture for AI agent observability
Start with a minimum set of signals, and record them consistently for every step. First, the trace structure itself: a trace identifier that follows the whole run, and span identifiers that link each step to its parent. Second, the inputs and outputs of each step, at least in summary form: the tool that was called and its arguments, the tool result, and the model output that followed. Third, the cost and timing signals: token counts per step, latency per step, and the resulting cost, so that a slow or expensive run can be traced to the step that caused it.
Fourth, record errors, retries and loop counts. A tool that fails once and succeeds on retry is a different story from a tool that fails repeatedly, and an agent that repeats the same step several times is a different story from one that moves forward. Fifth, attach evaluation signals to the same trace: a score, a pass or fail mark, or user feedback, bound to the run or span it judges. When evaluation data lives next to trace data, you can ask which steps correlate with good or bad outcomes, instead of maintaining two separate systems that never meet.
Finally, attach metadata for slicing the data later: user or session, agent version, and prompt version. Without version metadata, a trace can show that something broke, but not whether a new prompt or agent version caused it.
Instrumenting an agent step by step
Instrumentation is best done in a fixed order. First, choose a trace backend and a correlation identifier that follows the whole run. The backend can be a general tracing system or an agent-focused one; what matters is that every step of a run lands in the same trace, and that you can export or query the traces later. A dashboard you cannot query or export from is a display, not observability.
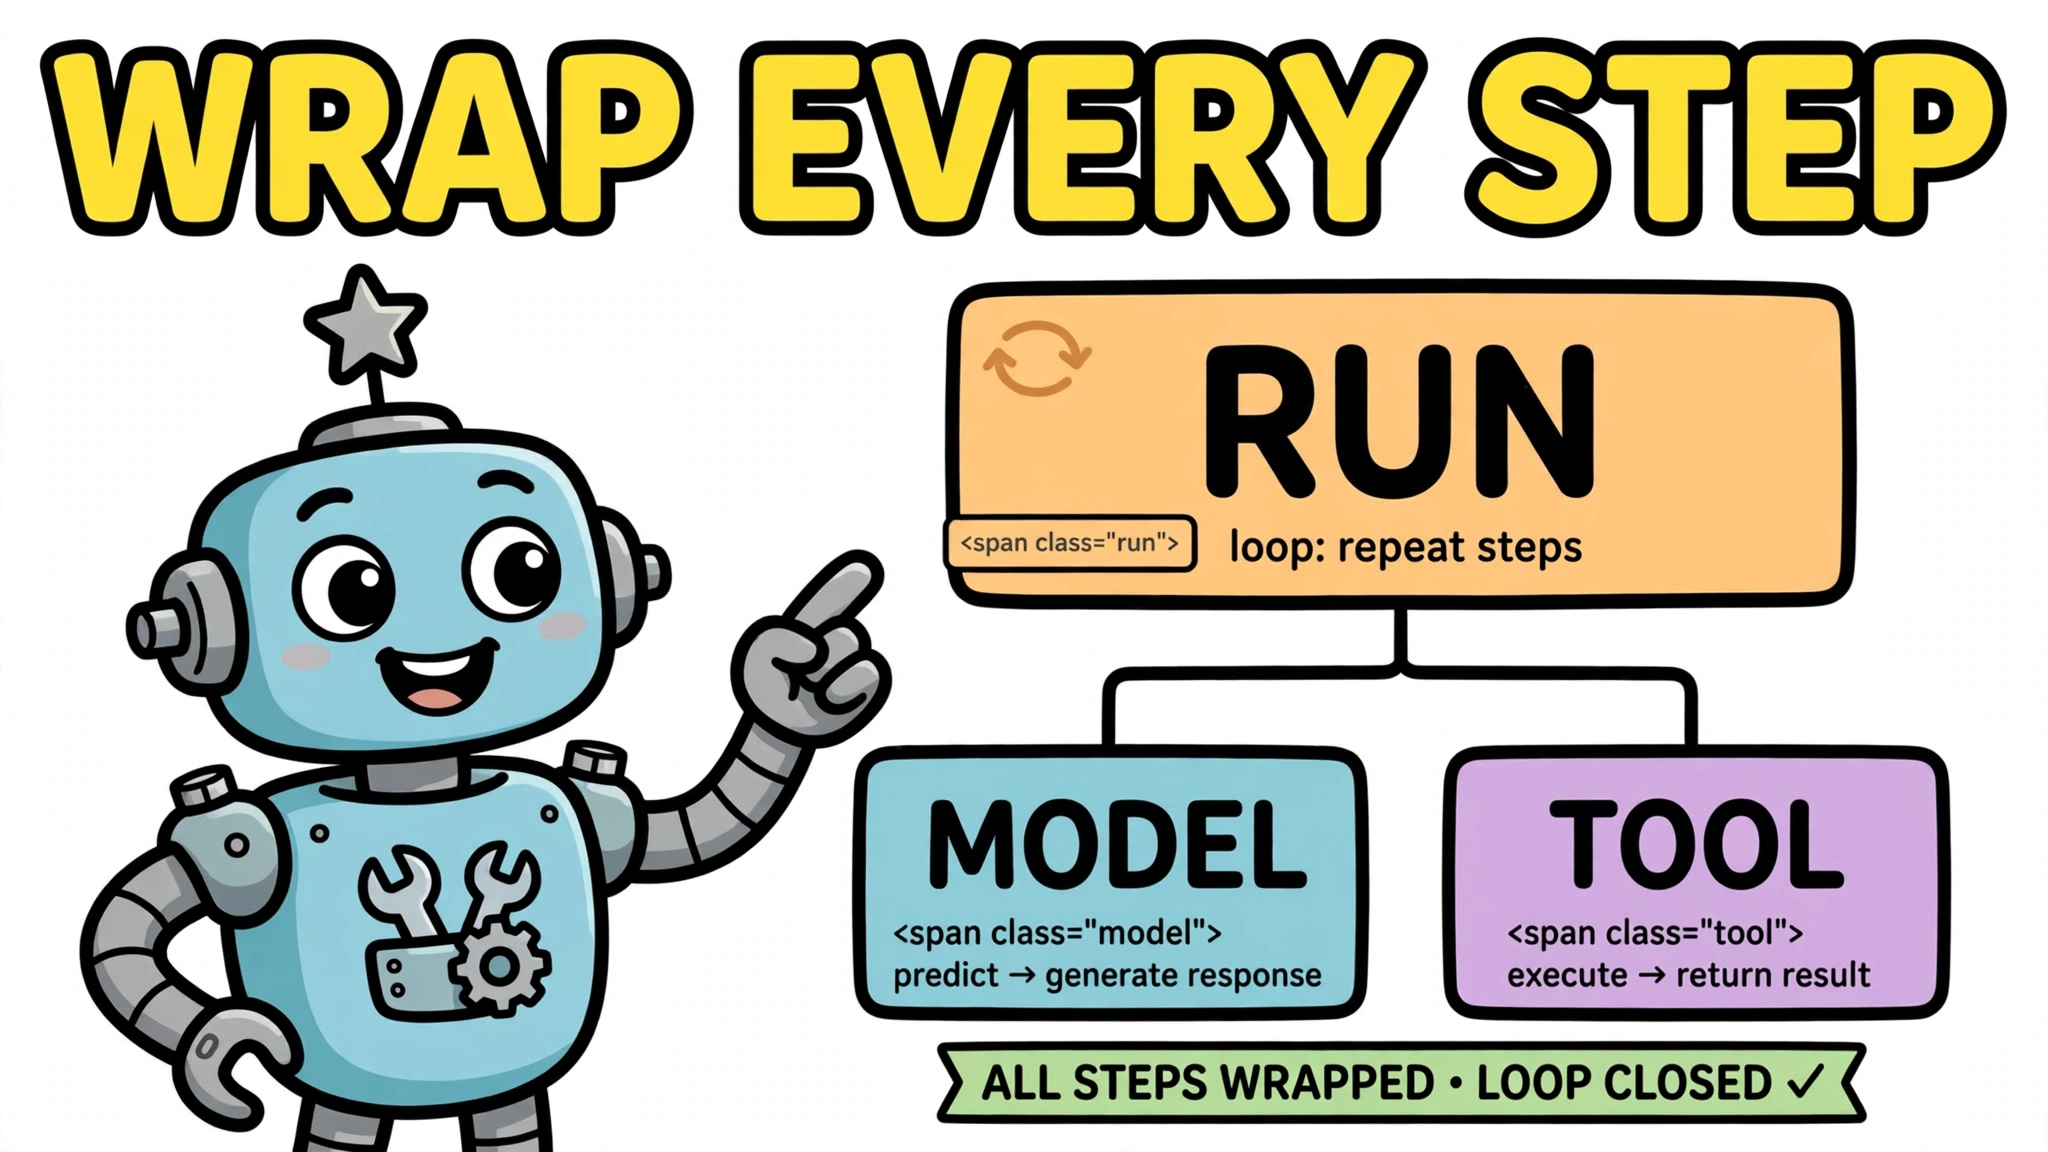
Second, wrap the agent loop so that every step opens a span with a parent-child relationship to the step that caused it. Frameworks differ in how much of this they do for you. The OpenAI Agents SDK, for example, has tracing built in and enabled by default, covering the overall run as well as agent spans, generation spans, function and tool call spans, guardrail spans and handoff spans. Other frameworks provide automatic tracing through integrations, or manual instrumentation through decorators, context managers, or explicit trace construction. If your framework does not instrument a step automatically, wrap that step yourself.
Third, record model, tool and retrieval spans consistently, using a shared naming scheme. OpenTelemetry’s GenAI semantic conventions provide standardized attributes for this purpose, including model name, token counts and finish reason, and auto-instrumentation packages exist for several providers and frameworks, including OpenAI, Anthropic, LangChain and LlamaIndex. Consistent attributes are what make it possible to compare runs across models and frameworks, and to build dashboards that do not break when you change a provider.
Fourth, handle sensitive data before it reaches the backend. By default, OpenTelemetry instrumentation for language model calls does not capture prompt and completion content; capturing message content is an opt-in. Treat that opt-in as a decision with privacy consequences, because prompts and tool data can contain personal or confidential information. Redact secrets and personal data, and decide on retention before you turn full-content capture on, not after a trace full of sensitive data has already been stored.
The following fragment illustrates the span-nesting idea in OpenTelemetry. It is a fragment only: it omits exporter setup, configuration and error handling, and it is shown to explain the structure, not as a complete program.
from opentelemetry import trace

tracer = trace.get_tracer("agent")

with tracer.start_as_current_span("agent_run") as run_span:
    with tracer.start_as_current_span("model_call") as model_span:
        pass
    with tracer.start_as_current_span("tool_call") as tool_span:
        pass
In this fragment, the run span is the parent, and the model and tool spans are its children. That parent-child structure is the whole point: it is what lets a viewer reconstruct the order and nesting of a run later.
Turning traces into dashboards and alerts
Once traces are flowing, turn them into a small set of dashboards that answer operational questions. A useful starting set covers success rate, latency, token cost and tool-error rate, broken down by agent and by step. The breakdown matters more than the totals: a total error rate can stay flat while one tool’s error rate climbs, and a total cost figure can hide one step that has started consuming far more tokens than the rest.
Alerts should follow the same logic. Alert on error spikes, on loops, on runaway token use, and on latency regressions, and route each alert to the trace that caused it. An alert that says only that errors increased is much less useful than an alert that links to the failing spans, because the trace is where the diagnosis happens.
Sampling and retention deserve an explicit decision at this stage. Recording every trace at full detail is simple at low volume and expensive at high volume, and traces that contain prompt content need a retention policy in any case. Decide what to sample, what to keep in full, and for how long, and record that decision alongside the instrumentation. A policy chosen deliberately is easier to defend than one discovered later in a storage bill or a privacy review.
Debugging a failed agent run from its trace
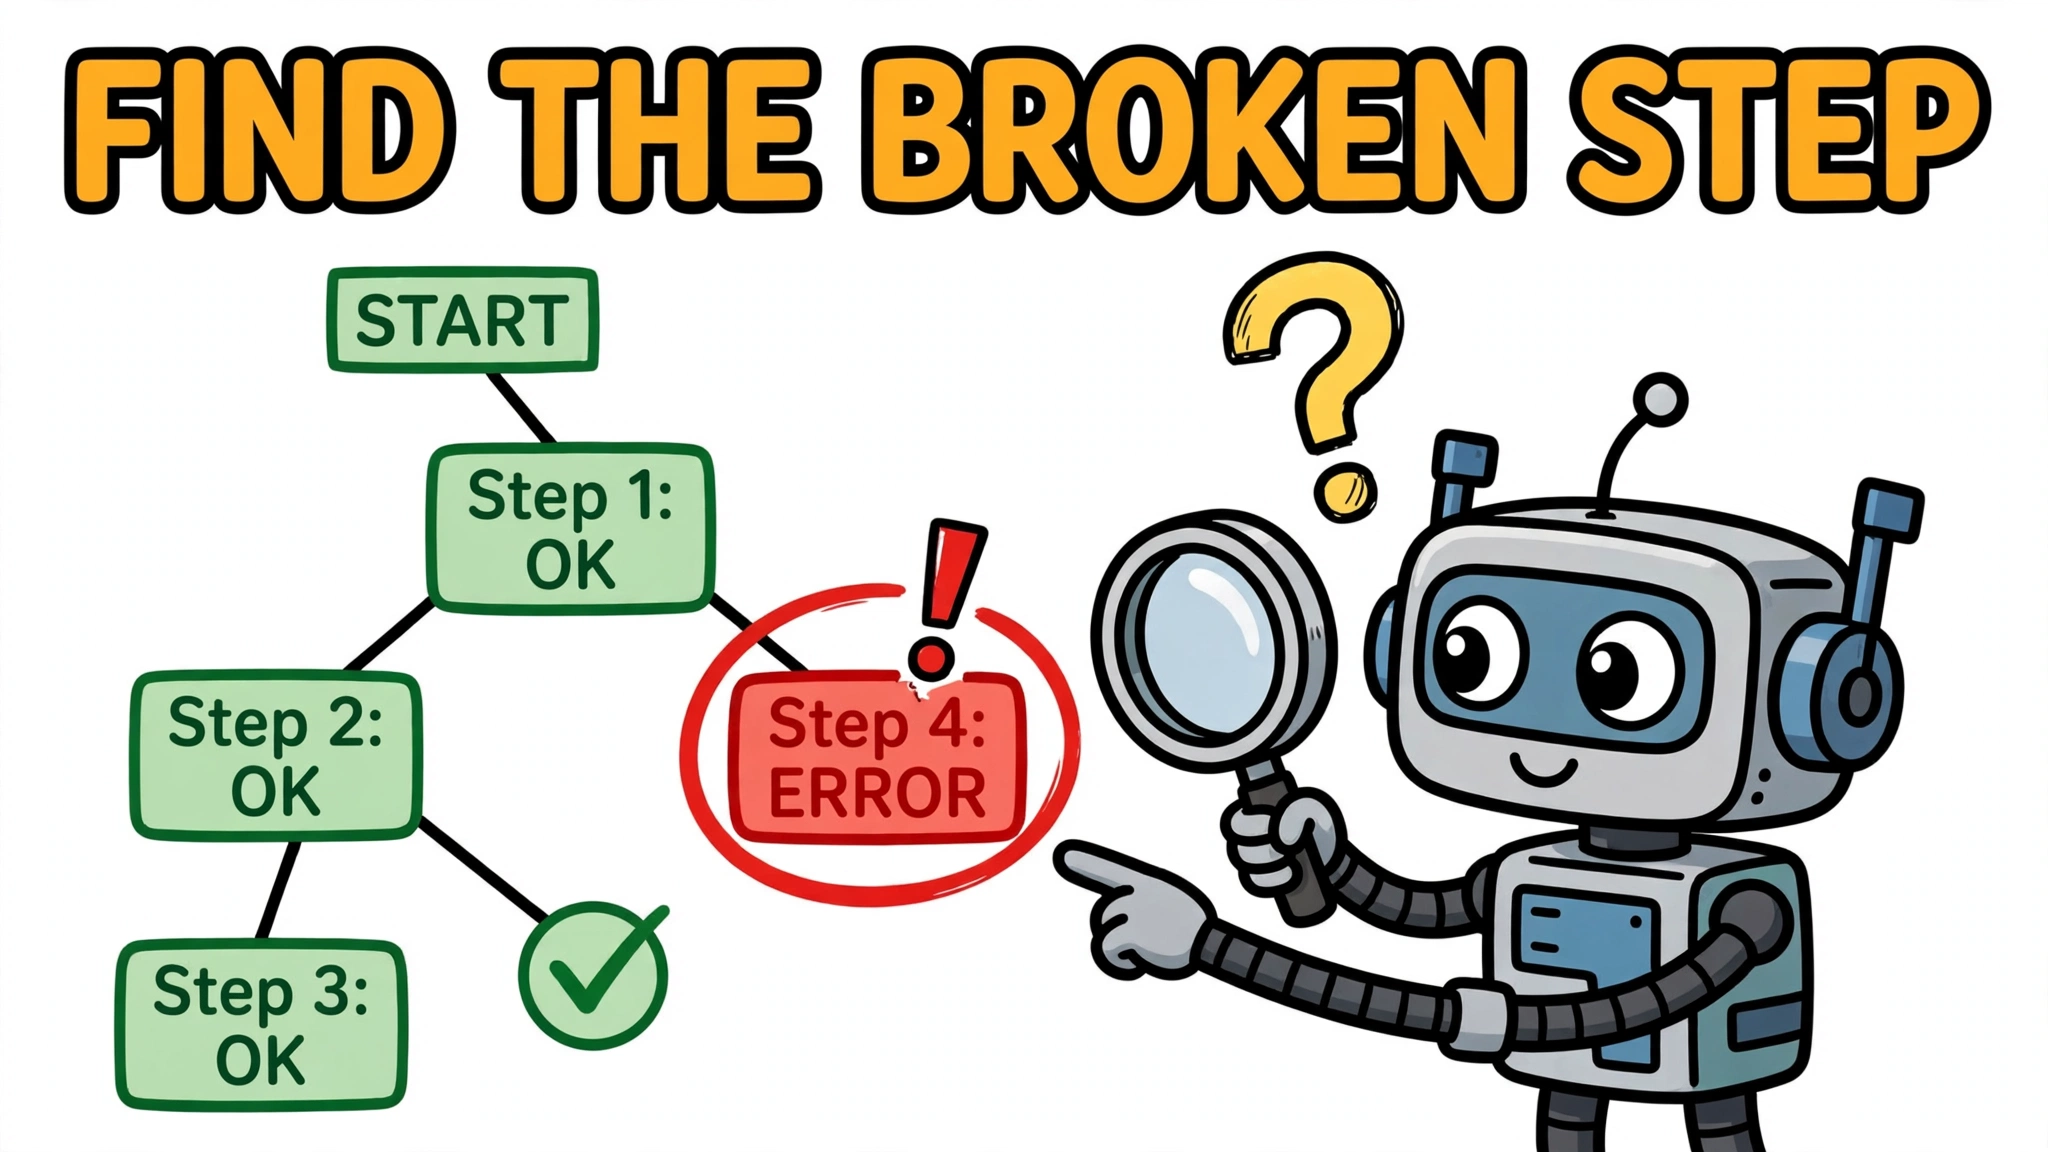
Debugging from a trace follows a simple order. Start at the top of the trace and read down to find the first step that looks wrong: a failed tool call, an unexpected tool choice, a retrieval that returned nothing useful, or a model step whose output does not match its inputs. Then inspect that span’s inputs and outputs in detail, because the failing span may contain the evidence the final answer hides.
Common failure patterns map neatly onto spans. A tool error shows up as a failed tool span, with a retry after it where the agent retries. A malformed tool argument shows up as a tool span whose inputs do not match what the tool expected. A loop shows up as the same span pattern repeating. A bad retrieval shows up as a retrieval span whose results do not support the model step that followed it. Output variation across runs is a signal to investigate, not a diagnosis: compare the recorded prompt version, inputs and model configuration across runs before attributing a change to prompt drift, model variability, or another execution difference — which is why recording the exact input, model parameters and version at the time of the call matters.
An example span from one observability guide illustrates the kind of per-step data a trace carries: input tokens 245, output tokens 89, and a duration of 1.2 seconds. That is an example, not a benchmark, but it shows the shape: token counts and duration attached to a single step, inside a trace that also shows the steps around it. With that shape, you can compare the failing step against successful runs of the same agent and see what changed.
Evaluating and guarding agents in production
Traces show what happened. Evaluations judge whether what happened was good. Attach evaluation scores to traces and spans, so that quality data and execution data can be queried together. In Langfuse’s model, for example, scores can be attached to a trace or a span, which means evaluation data lives next to the trace data it judges. In LangSmith’s model, feedback entries carry a tag and a score bound to a run by its run identifier, and multi-turn traces can be grouped into a thread through a thread identifier. The mechanism differs; the principle is the same: a score without a trace identifier is hard to act on, and a trace without a score is hard to judge.
Guardrails are the enforcement point that sits alongside tracing. In the OpenAI Agents SDK’s tracing model, guardrail spans record guardrail checks as steps in the run, alongside handoff spans for transfers between agents. Use guardrails and human-review triggers for high-risk tool actions: actions that change external state, send messages, or spend money should be the ones most likely to be held for review, not the ones most likely to slip through because tracing made them visible but nothing acted on them.
Cost and latency budgets belong in the same system. Set a budget per run, record token use and latency per step, and separate monitoring from enforcement. Monitoring and post-run alerts report that a budget was exceeded after the resources were consumed; they do not prevent that run’s overrun. Enforcement means checking recorded usage or elapsed time at defined execution boundaries and stopping or escalating further work when a configured limit is reached. Having no budget, and discovering a runaway run from a bill, is not a substitute for either.
Common mistakes and limits
Common pitfalls include logging prompts without traces, so failures cannot be reconstructed; recording sensitive data in traces without redaction or retention limits, which turns an observability system into a privacy liability; and treating a vendor dashboard as observability when the traces behind it cannot be exported or queried: if you cannot ask your own questions of the data, you are limited to the questions the vendor chose to answer.
There is also a limit worth stating plainly. Traces show what happened, not whether the outcome was correct. A trace can be complete, fast and cheap, and still record an agent confidently doing the wrong thing. That is why evaluation scores belong on traces, and why a trace review that never asks whether the outcome was right is only half an observability practice.
Done well, ai agent observability is not a dashboard you buy. It is a habit: every step recorded in a trace, every trace queryable, and every quality judgement attached to the run it judges. Spans provide evidence that supports investigation; whether a failure can be diagnosed depends on the detail captured and on evaluation or other context. Start with traces and spans, add cost and error signals, then dashboards, evaluations and guardrails — in that order.