


AI agent evaluation frameworks answer a simple question: does this agent actually work? A demo shows an agent succeeding once. A framework runs it against a task suite the evaluator chooses, scores each attempt by stated rules, and reports the result — repeating trials when the evaluation is designed to show whether the agent succeeds again. This article explains how they measure performance and reliability, where the numbers mislead, and how to run your own evaluation loop.
What an AI agent evaluation framework actually is
An evaluation framework for goal-driven agents has four parts: a task suite, scoring rules, an environment, and reporting. The task suite defines the work, the scoring rules decide what counts as done, the environment is where it runs, and the reporting is what the reader sees.
What makes agent evaluation different from testing an ordinary language model is that a goal-driven agent acts in steps: it plans, calls tools, reads results, and adapts. Evaluation must cover the whole trajectory, not a single output. A correct final answer can hide a bad path: extra tool calls that cost money, a skipped check, a database left in the wrong state. As the ThinkingBox team at Microsoft put it, “A trajectory is a claim. Database state is the evidence.”
The two things being measured: performance and reliability
Performance asks: did the agent achieve the goal, how well, and at what cost? Tokens, time and tool calls are real spend: a framework that ignores cost will pass an agent that spends far more than the task is worth. Reliability asks a different question: does it succeed consistently when the work is repeated, and how does it fail when it does not?
The distinction matters because a high average score can hide an unreliable agent. An agent that completes a task correctly 80 percent of the time sounds strong — but over a thousand runs a month, that implies about two hundred failures on average. And if each customer calls three times, then — assuming independent calls at the same success rate each time — the chance that all three go right is 0.8 cubed, a little over half. Performance is what the agent can do; reliability is whether you can depend on it when it matters.
How AI agent evaluation frameworks measure task success
Frameworks score success in three main ways, and which one a benchmark uses shapes everything about its numbers. The first is state comparison: run the agent, then compare the final state of the world — the database, the filesystem, the booked reservation — against the annotated goal state. This is what τ-bench does for customer-service tasks and what ThinkingBox does for business workflows.
The second is the hidden-test pass rate, used by SWE-bench. The agent is given a real GitHub issue and the repository, and it passes only if its patch makes the project’s held-out tests pass. SWE-bench contains 2,294 task instances drawn from twelve popular Python repositories, but the score says nothing about how the agent got there.
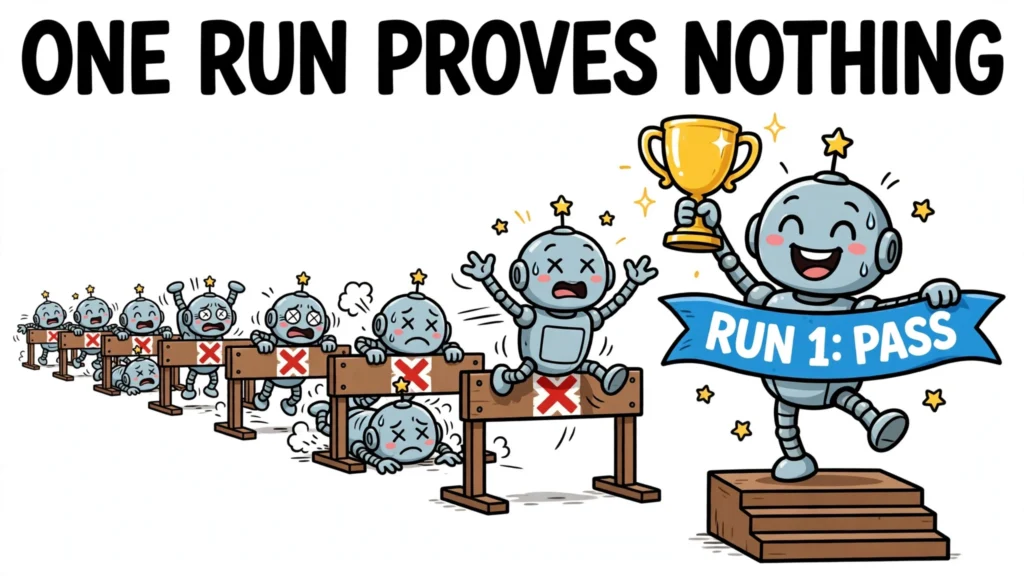
The third is exact final-answer matching, sometimes graded by a human or a judge model. GAIA uses this for general-assistant questions that need browsing, file handling and several correct steps chained together. Final-answer grading has a specific weakness: the right answer reached by luck counts the same as one reached by sound work. Most report the result as a pass rate on a single attempt — pass@1 — the headline figure on nearly every leaderboard, and one that says nothing about the second attempt.
How frameworks measure reliability
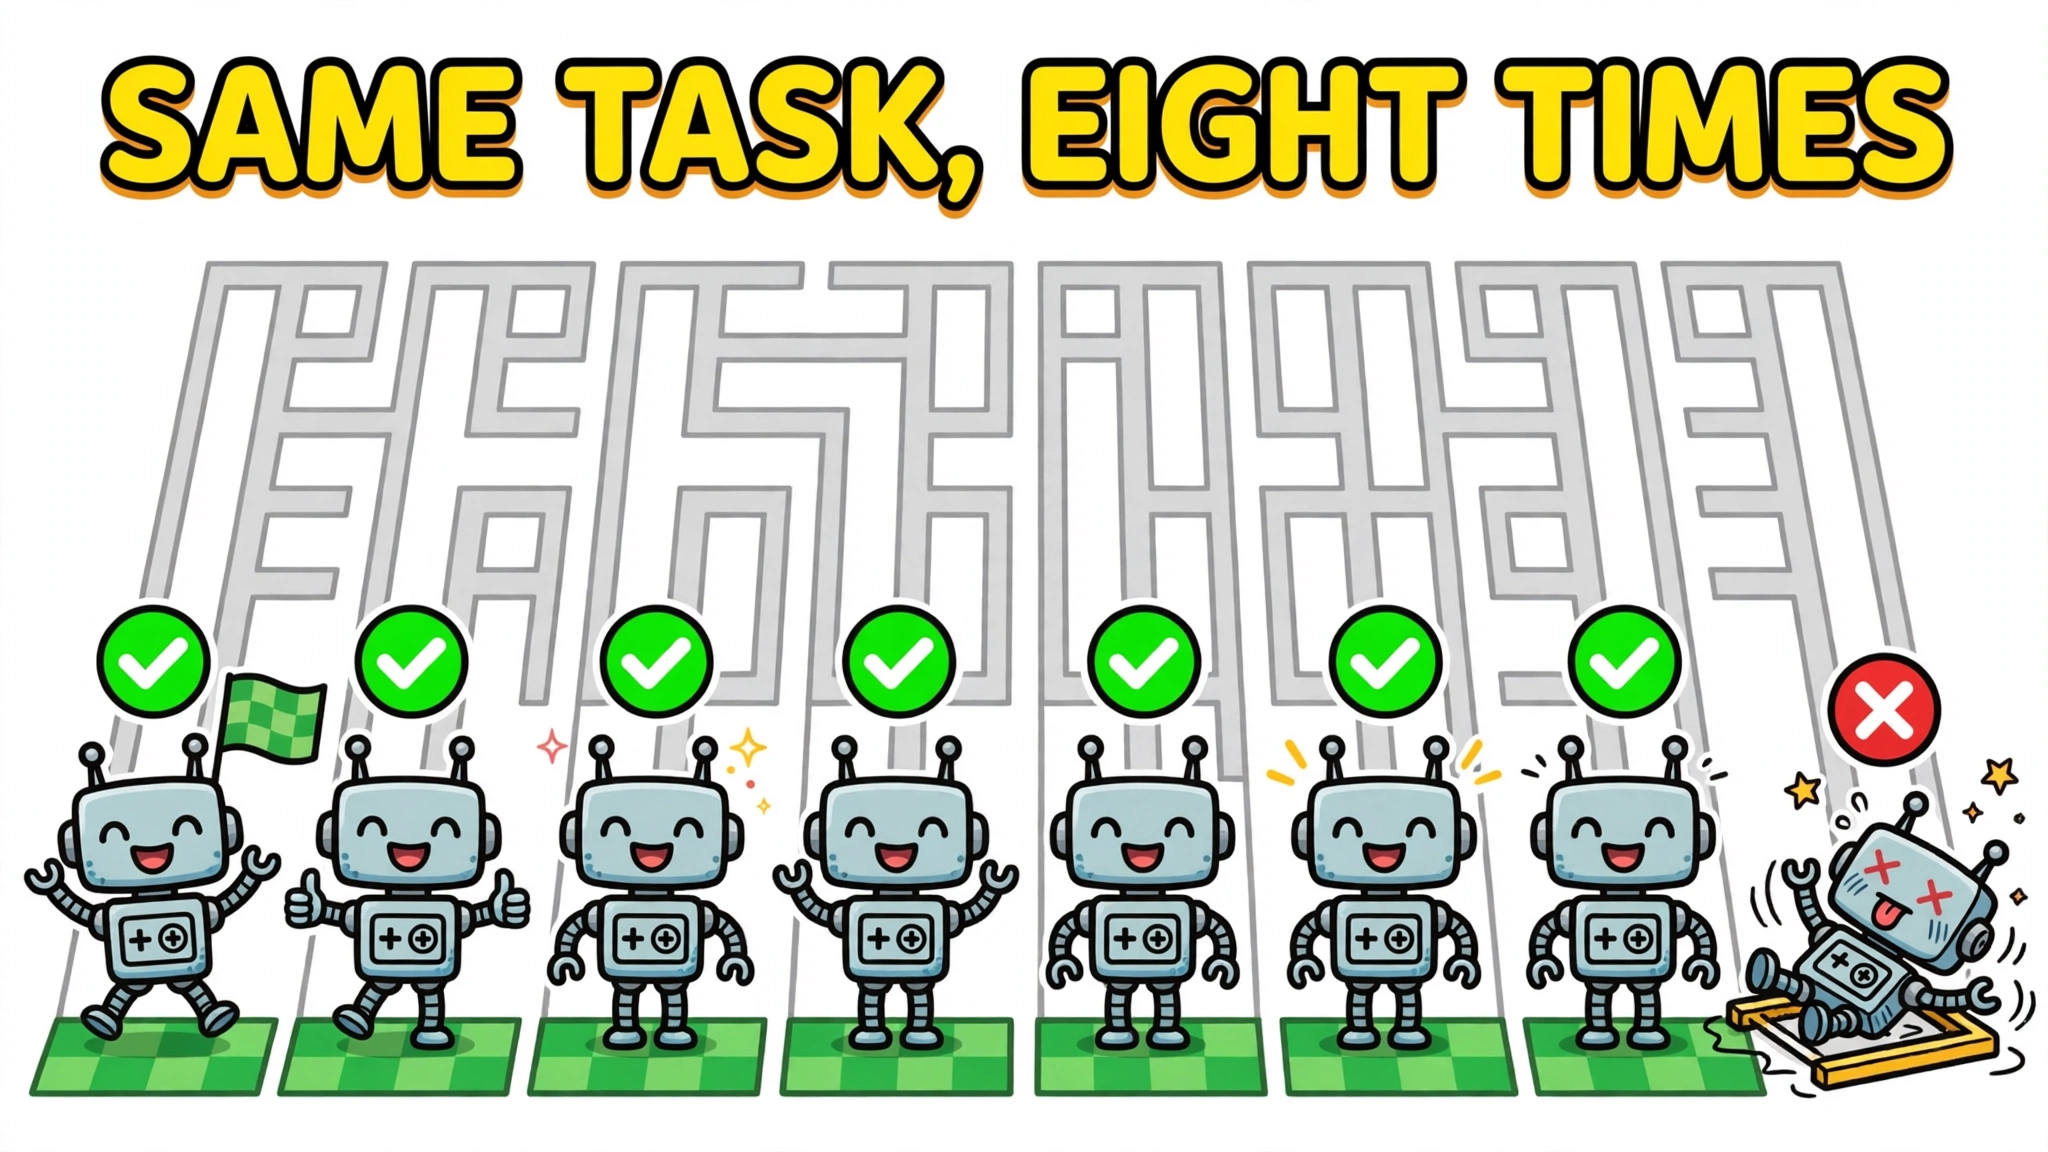
Reliability is measured by repeating the same task and counting how often the agent gets it right every time. τ-bench, from Sierra, introduced pass^k: the share of tasks on which all k independent trials succeed. pass@k, by contrast, counts a task as solved if any one of k attempts succeeds. If a task succeeds 75 percent of the time per trial, and trials are independent at that fixed rate, three successes in a row have a 0.75-cubed chance — about 42 percent.
In the original τ-bench paper, state-of-the-art agents such as GPT-4o succeeded on fewer than half the tasks overall, and in retail pass^8 — all eight trials must succeed — was under 25 percent.
Microsoft’s ThinkingBox makes the same point at larger scale. It runs 507 stateful business workflows across five domains twenty times each, grading the terminal database state. GPT-5.4 scored 65.36 percent pass@1, 91.12 percent pass@20, but only 25.25 percent pass^20. Claude Opus 5.5 led at 67.16 percent pass@1 and passed all twenty on 47.53 percent of tasks. The sharpest split is Kimi-K3: 93.89 percent solved at least once, only 13.41 percent on all twenty. Pass@20 measures what retries can find; pass^20 measures what the agent can repeat.
Variance is not a minor detail. In a 2026 study of 584 coding-agent runs on one machine-learning task, identical runs of one agent-and-model pairing varied more than the pairings differed from one another, so a few runs ranked the agents unreliably; resolving the differences would have taken tens to more than a hundred runs of each pairing. And consistency is no guarantee: in another 2026 SWE-bench study, Claude 4.5 Sonnet had the lowest variance and highest accuracy, yet 71 percent of its failures came from one wrong interpretation repeated across all runs.
Here is the pass@k and pass^k calculation:
trials = [
    [True, True, True, True, True, True, True, True],
    [True, False, True, True, False, True, True, True],
    [False, False, True, False, False, False, False, False],
]

def pass_at_k(trials):
    return sum(any(t) for t in trials) / len(trials)

def pass_pow_k(trials):
    return sum(all(t) for t in trials) / len(trials)

print(f"pass@8: {pass_at_k(trials):.2f}")
print(f"pass^8: {pass_pow_k(trials):.2f}")
pass@8 is 1.00 because every task was solved at least once; pass^8 is 0.33 because only one was solved on every trial. Same tasks, same trials — opposite stories about whether this agent is ready to ship.
The main evaluation approaches, compared
Evaluation happens in three kinds of places, and each trades realism for control. Static benchmarks are the cheapest and most reproducible: a fixed task set, a fixed scoring rule, no live systems involved. SWE-bench, GAIA and AgentBench all work this way. Their weakness is that they are fixed: tasks go stale, scores saturate, and scaffolds get tuned to the test set.
Simulated environments sit in the middle. WebArena drops agents into self-hosted replicas of real websites and scores whether the end state matches the task’s intent. OSWorld gives the agent a real desktop operating system to control. τ-bench simulates the user: a language model plays the customer while the agent works with real domain APIs and a written policy.
Live and online evaluation is the most valid and the hardest to reproduce. The agent works on real users, real tools and real state — but live websites drift, APIs change, and the same evaluation run twice is never quite the same evaluation. Across all three, a fourth mechanism does most of the scoring work for open-ended tasks: LLM-as-a-judge, a judge model grading the agent’s output or trajectory against a rubric. It is the standard way to score work with no single right answer, but the research documents real limits on its verdicts — the next section works through them.
What the leading frameworks measure in practice
The leading benchmarks each test a different capability, so scores from one cannot be read as scores from another. SWE-bench measures tool use against real software-engineering work. GAIA measures general-assistant reasoning with web browsing and tool use. WebArena measures long-horizon web navigation. OSWorld measures control of a whole desktop. τ-bench measures multi-turn conversation with a simulated user, tool calling, and obedience to a written policy. AgentBench spans eight environments, from operating systems to databases and games. ThinkingBox tests production-shaped work: 507 policy-conditioned business workflows graded on database state, run twenty times each.
A 60 percent on SWE-bench and a 60 percent on τ-bench describe different jobs, scoring rules and failure modes. The reader’s job is to ask which task, which rule, which environment — and how many times it was run.
How to read an evaluation result without being misled
Start with the metric. A pass@1 headline is capability on a single attempt, not reliability. Ask for pass^k — the share of tasks passed on every trial — before concluding anything about deployment. pass@k alone is optimistic: it counts a task as solved if any attempt worked.
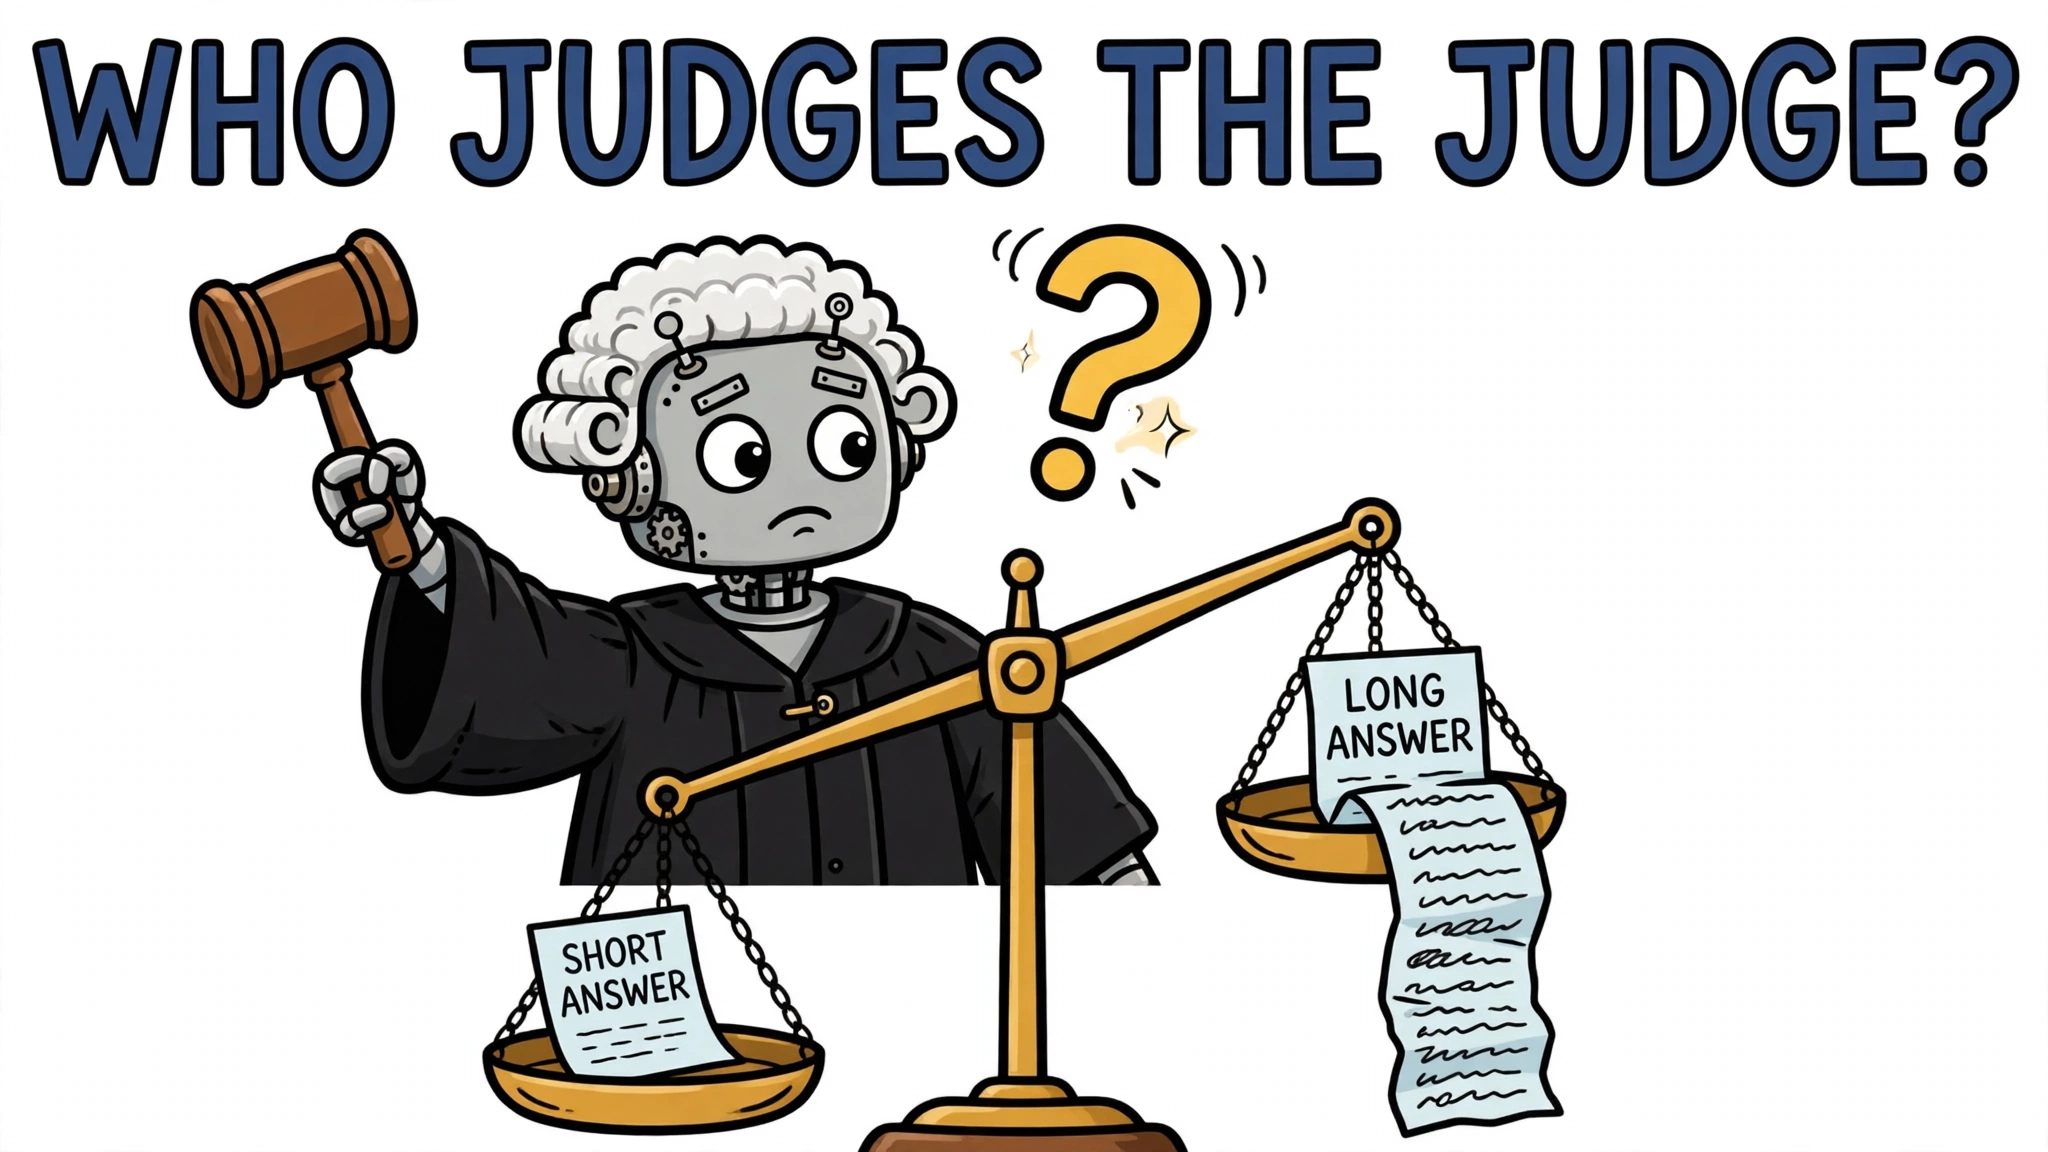
Then ask about the judge. LLM-as-a-judge is the standard way to score open-ended agent work, but its validation is shakier than the field admits. The original MT-Bench paper reported strong judges like GPT-4 agreeing with human preferences more than 80 percent of the time — but only where the judge returned a clean, decisive verdict. Folding in ties and position reversals drops agreement to roughly 60 to 64 percent. A 2026 study of 21 judge models and 541,000 judgments found raw agreement overstates chance-corrected agreement by 33 to 41 points on MT-Bench, judge rankings shift by up to 14 positions across benchmarks, and test-retest reliability above 0.95 coexisted with severe position bias above 0.10 in two production-deployed judges. Running the same judgment prompt 100 times with only the random seed changed produced significant inconsistency on multi-turn dialogues.
Then check sample size. At twenty tasks, the 95 percent confidence interval on a pass rate is roughly plus or minus 17 to 22 points; at a hundred tasks it is still plus or minus 8 to 10. A five-point difference needs roughly 1,000 to 1,600 examples per arm unpaired — or about 290 paired, where both agents run the same cases.
Finally, look for what the benchmark does not measure. Most benchmarks give agents one attempt, do not account for cost, and test on clean tasks unlike real work. As one 2026 roundup puts it, an agent that spends $50 in API calls to fix a $5 bug still passes SWE-bench. A score that ignores cost, retries and failure modes is a score about a demo, not a deployment. There is still no shared reporting convention across frameworks.
Building your own evaluation loop
You do not need a benchmark to evaluate your agent. You need a golden set, a scoring rule, and the discipline to run it more than once. Start from real user tasks: pull ten to twenty real requests from production traffic or support logs. For each, define the success criteria before running anything: what should exist when the task is done, and what must not have happened.
Run each task several times. Ten runs per task is a starting heuristic, not a statistical guarantee: the trials a task needs depend on the agent’s variability and the decision at stake. The variance study found resolving observed differences could take tens to more than a hundred runs each. Log the full trajectory of every run, because the trajectory is where the failures live. Then categorize the failures: planning errors, tool errors, policy violations, recovery failures. In ThinkingBox, most failures traced to unrecovered tool errors rather than wrong reasoning — a pattern only visible if you classify failures instead of counting them.
Score the trajectory, not just the ending. LangSmith’s AgentEvals package, for example, scores the full trajectory of messages and tool calls, with deterministic trajectory matching (strict, unordered, subset or superset modes) and LLM-as-judge trajectory scoring where reasonable variation is expected.
{
  "task_id": "retail-refund-014",
  "agent": "support-agent v2.3",
  "model": "gpt-4o",
  "trials": 8,
  "successes": 5,
  "pass_at_8": true,
  "pass_pow_8": false,
  "failure_modes": ["policy-violation", "unrecovered-tool-error"],
  "cost_usd": 1.42,
  "steps": 14
}
Three mistakes recur in teams building their first eval. The first is evaluating only on easy tasks: if every case passes, inspect task coverage and difficulty: a golden set that never fails may simply be too easy. The second is running each task once: a single run tells you the agent can do it, not that it will. The third is having no baseline: run the previous version on the same cases.
The goal is an evaluation honest enough to gate a release on: a golden set drawn from real work, success criteria written before the run, repeat trials with pass^k beside pass@1, trajectories logged, failures categorized, and a baseline to compare against. An agent that passes that loop may still surprise you in production; one never evaluated on representative repeated tasks leaves that uncertainty unmeasured.