
AI agent monitoring is how you know what a production agent actually did, not just whether its server stayed up. Service availability and a successful request status do not measure whether an agent completed its task correctly: an agent can answer promptly, spend heavily, call the wrong tool three times, and still return a confident final message that is wrong. Monitoring an agent therefore means recording each run in enough detail to reconstruct it, turning those records into signals you watch, and checking the agent’s behaviour against what the task required. This guide explains what to collect, how to set it up, how to alert without drowning in notifications, and how to keep the cost and the private data in those records under control.
AI Agent Monitoring: What Production Visibility Actually Means
A production agent run is a sequence, not a single request. The agent receives a task, calls a model, reads the result, calls a tool, observes what comes back, updates its state, and repeats until it finishes, escalates, or stops. In the OpenAI Agents SDK, that record is organised as a trace: one end-to-end operation of a workflow, composed of spans. A span is one operation with a start time, an end time, a trace identifier, a parent span, and data about what happened. A trace carries a workflow name, a unique trace identifier, and optionally a group identifier that links several traces from the same conversation, plus metadata you choose to attach.
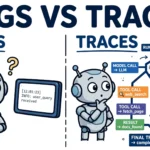
Four kinds of record answer different questions. Logs are timestamped events: useful for reconstructing order, weak for relating steps to each other. Traces show the hierarchy of a single run: which model call led to which tool call, and what each step returned. Metrics aggregate numbers over many runs: latency distributions, error rates, token use, and cost. Evaluations judge quality: whether the run did the job, against a task, a rubric, or the final state of the world. Anthropic makes the same distinction from the evaluation side, defining a transcript as the complete record of a trial, including outputs, tool calls, reasoning, intermediate results, and any other interactions, and the outcome as the final state of the environment at the end of the trial. The transcript tells you what happened; the outcome tells you whether it mattered.
That is why uptime and latency alone cannot tell you whether an agent did the right thing. A run can complete quickly, return a successful status, and still have booked nothing, changed the wrong record, or answered from a stale document. The agent decides its next step at run time, so the only way to know what it decided is to keep the record of its steps.
The Signals That Matter: Traces, Tool Calls, Latency and Cost
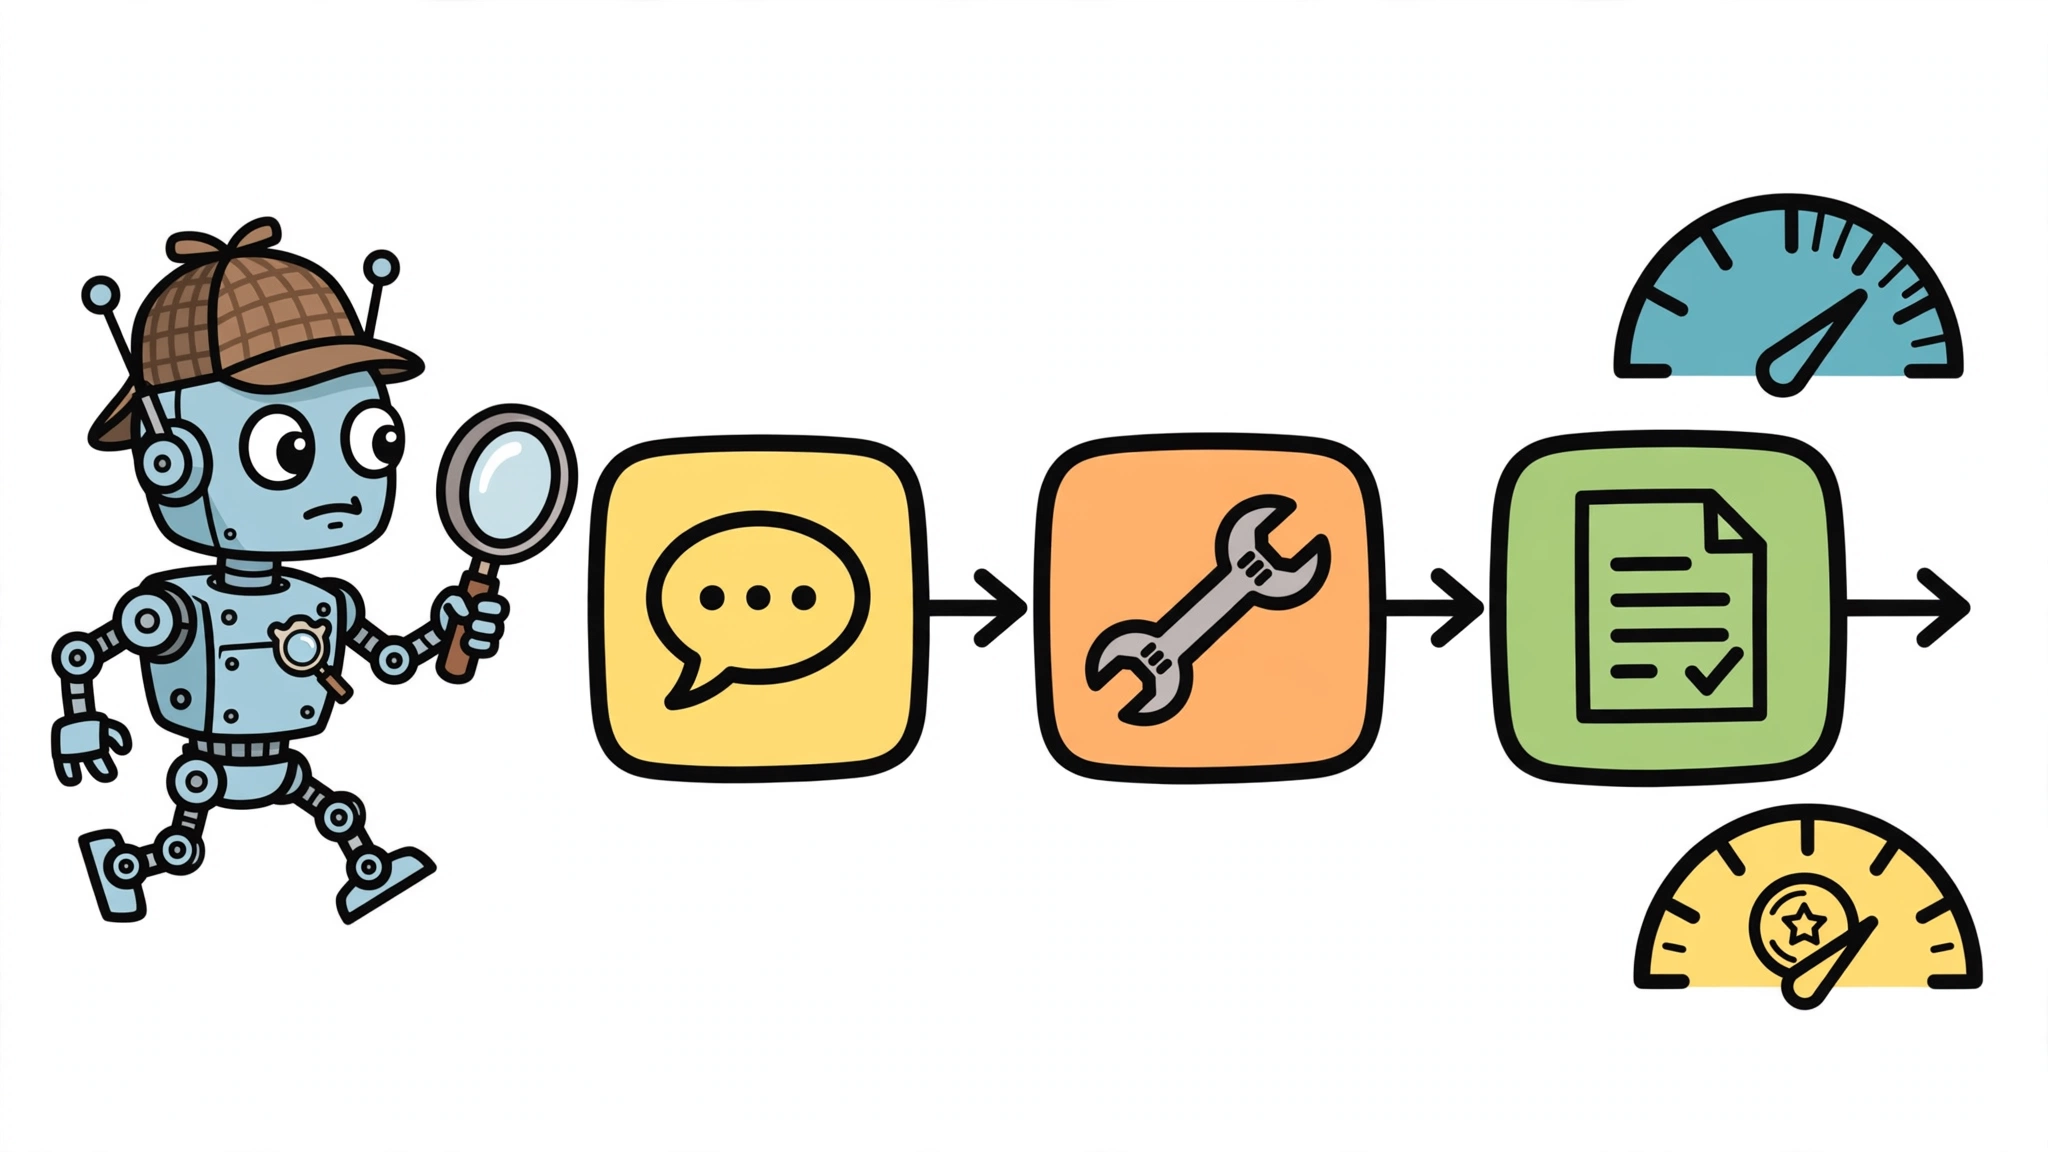
Start with the full run trace. By default, the OpenAI Agents SDK wraps the whole run in a trace, each runner invocation in a task span, each model turn in a turn span, each agent run in an agent span, each language model generation in a generation span, each function tool call in a function span, and guardrail checks and handoffs in their own spans. Picture a customer support task: the trace is the whole task, and inside it a turn span holds a generation span that produces a tool call, then a function span for the account lookup, then another generation span that drafts the reply. If the lookup fails, the trace shows exactly where, with the arguments sent and the error returned, instead of a log line saying the task failed.
On top of the trace, collect per-step and per-run numbers: latency per span, token counts per generation, error and retry counts, and tool-call success rates. The OpenTelemetry GenAI semantic conventions give these numbers a shared vocabulary across frameworks. The required attributes are the operation name and the provider name, the model goes in the request model attribute, and token counts go in usage attributes for input and output tokens. Two standard metrics cover token usage and operation duration. Because the conventions separate input, output, cache-read, cache-write, and reasoning tokens into distinct attributes, cost attribution can follow the same split instead of treating every token as equal.
Finally, watch behaviour signals, not only performance numbers: task completion, escalation and human-approval rates, and repeated or looping tool calls. A rising count of identical tool calls with the same arguments is worth flagging even when every call succeeds, and a growing approval queue may mean a change in the tasks, the model, or the guardrails. Keep these signals grouped by task type, user, model, and tool, so a problem in one kind of work does not hide inside a healthy average.
Set Up Tracing and Logging Step by Step
First, turn tracing on and choose how each bounded workflow operation is traced. In the OpenAI Agents SDK, tracing is enabled by default, and you can name the workflow, set a group identifier such as a chat thread identifier to link related traces, and attach metadata for filtering later. LangSmith records the same hierarchy: a trace is the full execution of one request, and each run inside it is one step such as a model call or tool call. Treat one trace per workflow operation or turn as a design choice, and correlate related operations or turns with a shared task, group, or session identifier, so the steps of one piece of work can be found together. If a run cannot be retrieved by its task identifier, debugging it means searching through unrelated runs.
Second, record the steps that matter and nothing you cannot justify keeping: tool calls with their arguments and results, model inputs and outputs, and state transitions, so a failed run can be reconstructed and investigated from its trace. That is inspection of the recorded steps, not a replay of the run: replay would need the retained state, environment, and tooling that a trace on its own does not provide. At the same time, decide what must not be stored. The OpenAI Agents SDK stores generation inputs and outputs in generation spans and tool inputs and outputs in function spans, and those may contain sensitive data; its sensitive-data setting, on by default, controls whether that data is captured, and tracing is unavailable entirely for organisations under a Zero Data Retention policy. LangSmith offers the same control in a different form: you can hide inputs, outputs, and metadata entirely, apply rule-based masking, redact secrets with the software development kit’s anonymizer, or use a third-party anonymizer for personal data. Apply redaction before the trace leaves your application process, not after it lands in a shared store.
Third, make sure traces actually arrive. The OpenAI SDK’s default trace processor exports in the background every few seconds and flushes when the process exits, which is usually enough for a web server, but background workers need an explicit flush at the end of each unit of work, or the last traces of a job may never appear. Custom trace processors can also send the same traces to a second destination. Then aggregate the traces into dashboards grouped by task type, user, model, and tool, and keep the raw traces retrievable: a dashboard answers whether something is wrong, and the raw trace answers what happened in the one run a user is complaining about.
Turn Signals into Alerts Without Alert Fatigue
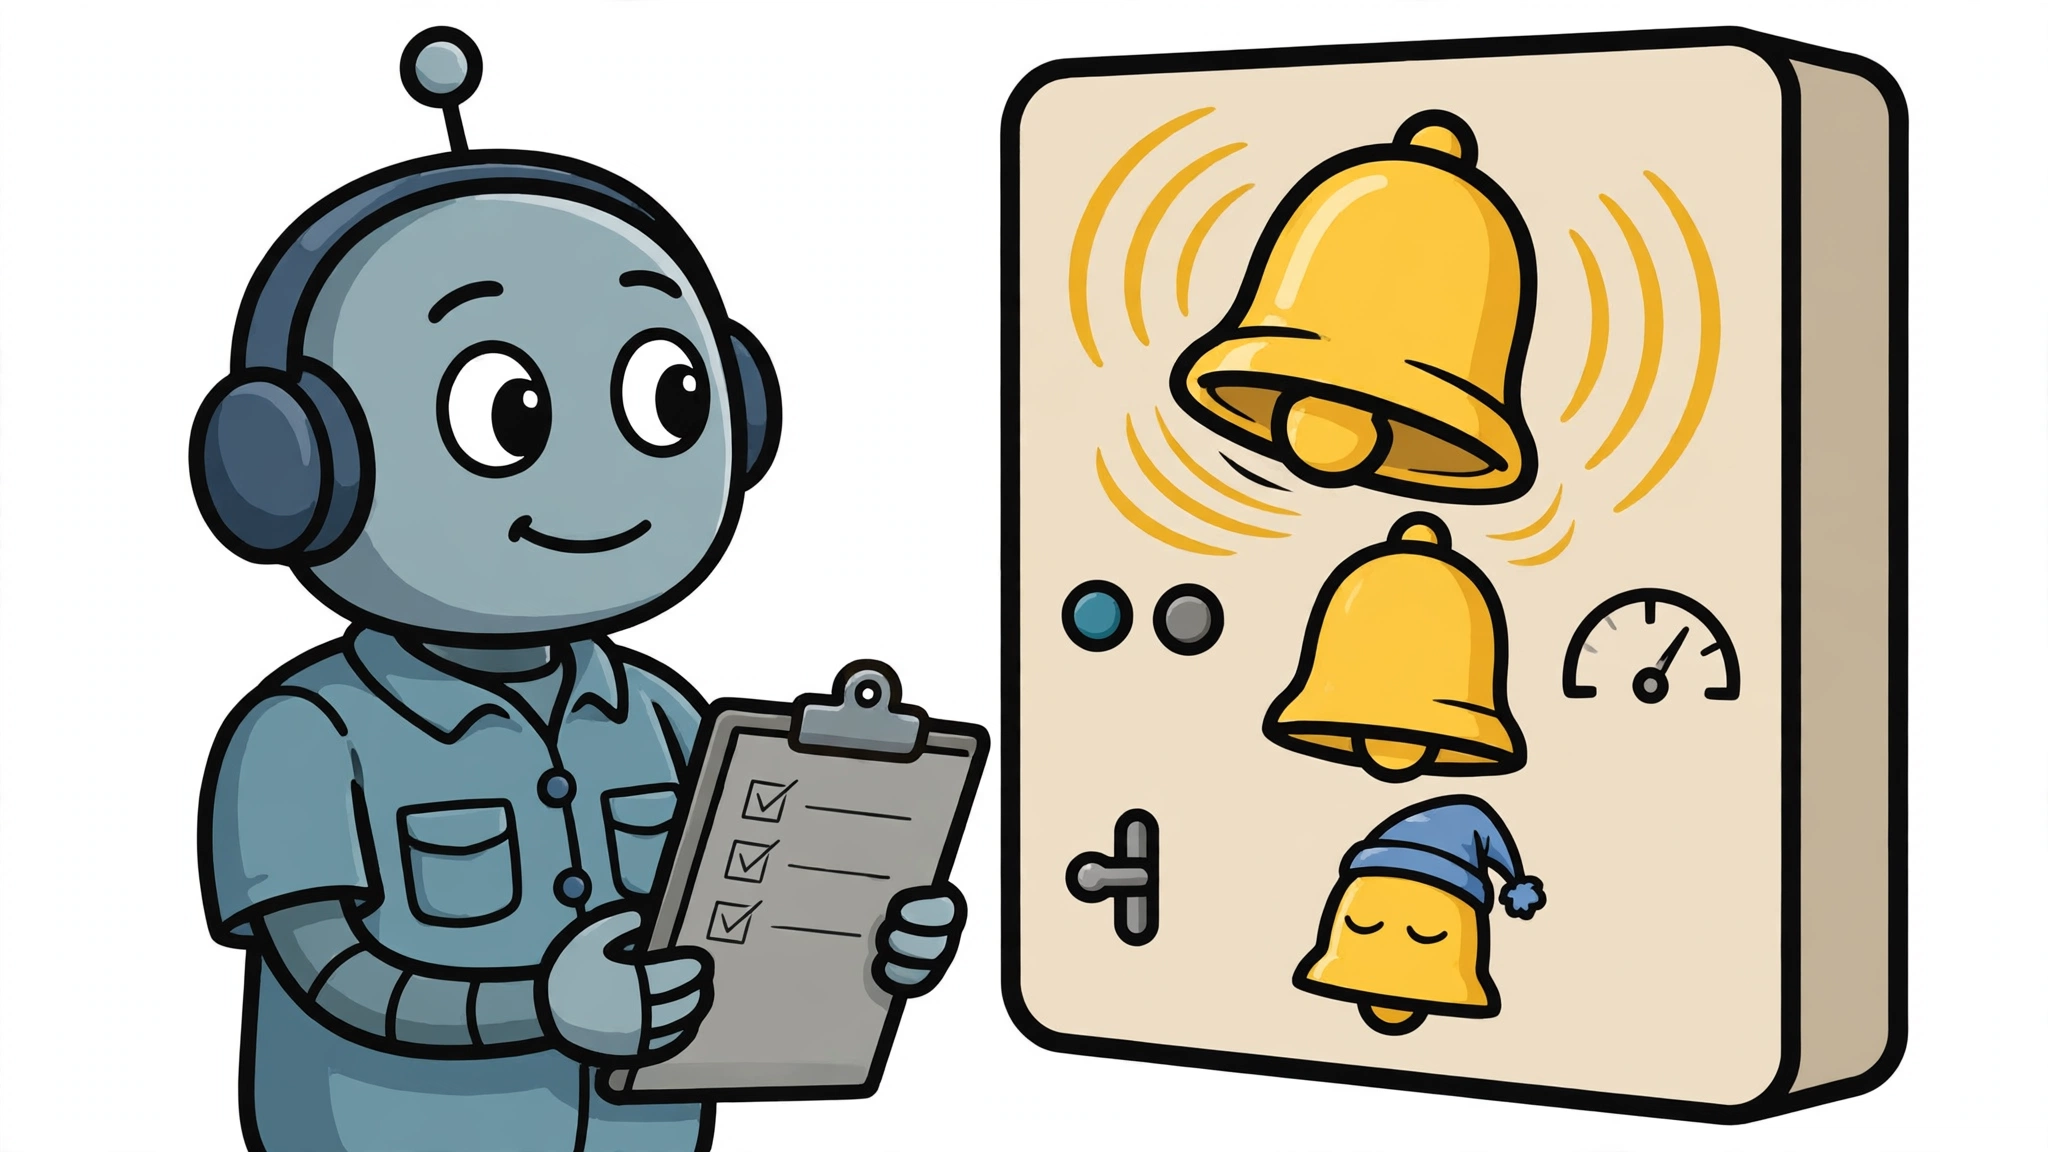
Alerts should fire on changes from normal behaviour, not on every unusual number. Establish a baseline for each signal over a representative period: typical error rate, latency distribution, cost per run, loop and retry counts, and approval-queue age. Then set thresholds as starting points to calibrate, and review them as the baseline moves. There are no vendor-standard thresholds for agent error rate, latency, or cost in the sources consulted for this article, so any fixed number is a guess until your own data supports it. One practitioner guide illustrates a dashboard with a 95th-percentile latency threshold of five seconds and an error-rate threshold of five percent; treat those as an example of how a table looks, not as defaults to copy.
Grade alerts by severity, and route each grade to the people who can act on it:
| Severity | Example signal | Response |
|---|---|---|
| Page | Error rate or cost per run far above baseline, or a guardrail failing open | Wake the on-call engineer; consider halting or degrading the agent |
| Ticket | Sustained latency or retry increase, approval queue growing | Investigate during working hours; check recent model, prompt, or tool changes |
| Watch | Small drift in one task type or one tool’s success rate | Log and review in the next operations review |
For high-impact, destructive, or irreversible actions, decide in advance, as a risk-based policy the team explicitly configures, whether the agent should halt, degrade, pause for human approval, or alert and continue. Guardrails and human approval are the safeguards that make a pause possible: the run pauses, a person decides, and the trace records the decision. Which response fits depends on the action and the safeguards in place, not on a single rule for every such action. For everything else, prefer alerts that compare against a baseline and require the deviation to persist for a short window before firing, so a single slow run does not page anyone and a real regression still surfaces within minutes.
Evaluate Agent Behaviour in Production
Monitoring tells you what happened. Evaluation tells you whether it was good enough, and it needs three layers working together. Anthropic’s guidance recommends combining automated evals, production monitoring, and selective human studies, because each layer covers a weakness of the others: automated tests run repeatedly and at scale, production monitoring reveals behaviour on real usage patterns, and human review provides judgement where automated grading is incomplete. A team should not assume an agent is safe or production-ready solely because it performs well on a static test set.
For production evaluation, sample real runs for human review and score them against task-specific rubrics, run automated checks on outputs on a schedule, and compare current runs with a known-good set to catch regressions after a model, prompt, or tool change. Automated checks can cover format, grounding, policy, and tool-use rules. LangSmith’s online evaluators run automatically on live traces for this purpose, including safety checks and format validation, without needing a dataset. Langfuse and Arize Phoenix attach scores from model-based judges or code evaluators to observations and traces, so quality results can be filtered alongside the trace that produced them. Use several grader types, as Anthropic recommends: code-based graders for checks that are exactly verifiable, model-based graders for open-ended quality, and human graders as the reference that calibrates the other two. Grade the outcome and the final state of the environment wherever that is checkable, not only the words of the final answer, and run each task several times, because model outputs vary between runs.
Close the loop. When a production failure is found, turn that run into a dataset case, add it to the offline evaluation suite, and require the fixed agent to pass it before the next deployment. Keep capability evals and regression evals separate: capability evals ask whether the agent can do a kind of task yet and should include hard tasks, while regression evals should pass at nearly one hundred percent and exist to prove that working behaviour has not broken. If a test set no longer distinguishes meaningful improvements, it needs harder or more representative tasks drawn from real production work.
Cost, Privacy and Data Handling in Monitoring
Monitoring costs money twice: once for the agent’s own token and tool use, and once for storing and processing the traces that describe it. Attribute the first cost per run, per task type, and per user, using the token and tool-call counts recorded in the trace, so a cost spike can be traced to the work that caused it. For the second cost, understand the billing unit of the platform you use. Langfuse, for example, counts every tracing data point sent to it, a trace, an observation, or a score, as one unit, and its cloud retention tiers are thirty days on the Hobby plan, ninety days on Core, and three years on Pro and Enterprise. Check the live pricing page before quoting any figure, since plans change. Retaining full-fidelity traces for every run can be the most expensive option, depending on volume, capture cost, and how much sensitive data must be handled; sampling is one lever that controls that bill, alongside retention limits and what is captured in the first place. One optional strategy is error-biased retention: instrument every run, but retain errors and flagged runs in full while sampling ordinary runs, rather than keeping everything or a random slice that may drop the failures you most need. Whether that works depends on the sampling stage: an error found only after an ordinary run was sampled away cannot be recovered from a trace that was never retained, so decide what is sampled, and when, as part of the retention policy, weighing cost, privacy, and implementation effort.
Privacy is the stricter constraint. Traces routinely contain the data the agent worked with: names, email addresses, account details, credentials in tool arguments, and the full text of user requests. The OpenTelemetry GenAI conventions make content capture opt-in for exactly this reason: prompt and response bodies are separate, explicitly enabled events, not standard span attributes, because they routinely contain personal information. LangSmith’s data policies for its language model gateway work the same way: with trace content switched off, traces still record token usage, latency, status, model information, and policy results, but request and response bodies are not stored, and detected personal information or secrets are replaced with placeholders before the request reaches the provider. LangSmith’s secret handling replaces a marked credential with a placeholder label before upload, and its built-in preset detects common key formats, including provider key prefixes and private key blocks. Set a retention limit for stored traces, restrict who can read production traces, and keep an audit trail of access. Redaction that happens only after a trace has been stored in a shared system has already let sensitive data cross a boundary it should never have crossed.
Common Monitoring Mistakes and a Launch Checklist
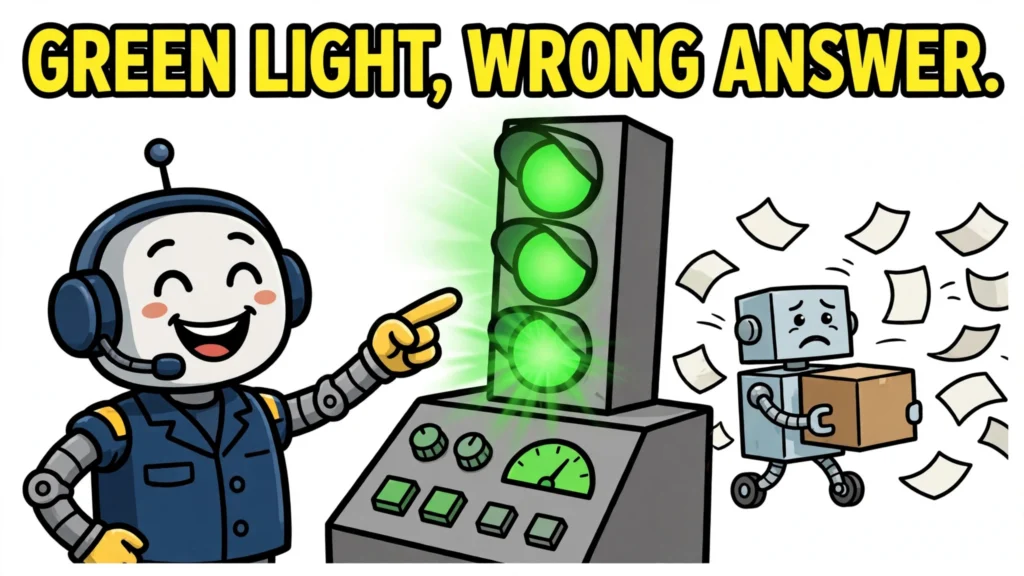
The most common mistakes follow from the sections above. Logging prompts without redaction turns the trace store into a copy of your users’ private data. Alerting on every anomaly trains the team to ignore alerts, which is worse than having fewer alerts. Sampling too little, or sampling at random without keeping failures, leaves rare but serious problems invisible. Treating a green dashboard as proof of correct behaviour confuses the absence of errors with the presence of quality: a run can be fast, cheap, and error-free while doing the wrong thing, and only evaluation catches that. Monitoring also has a limit: it shows what happened, step by step, not why the model chose one step over another, and some failures need human judgement, not more data.
Before launch, work through this checklist. Tracing is instrumented for every run, with a task, group, or session identifier correlating related traces and retained raw traces retrievable under the chosen retention policy. Dashboards group the signals by task type, user, model, and tool, and show latency, cost, error rate, and behaviour signals together. Alerts are graded by severity, tested by triggering them deliberately, and calibrated against a baseline rather than copied from an example. Sampling and a human review rota are set, with production failures feeding back into the evaluation dataset. Retention and redaction are verified: sensitive data is removed before storage, secrets never reach the trace store, and access to production traces is restricted and audited. If every item on that list is true, you can answer the question this article started with: not just whether the agent is running, but what it did, whether it did it well, and what changed when it did not.